Power BI

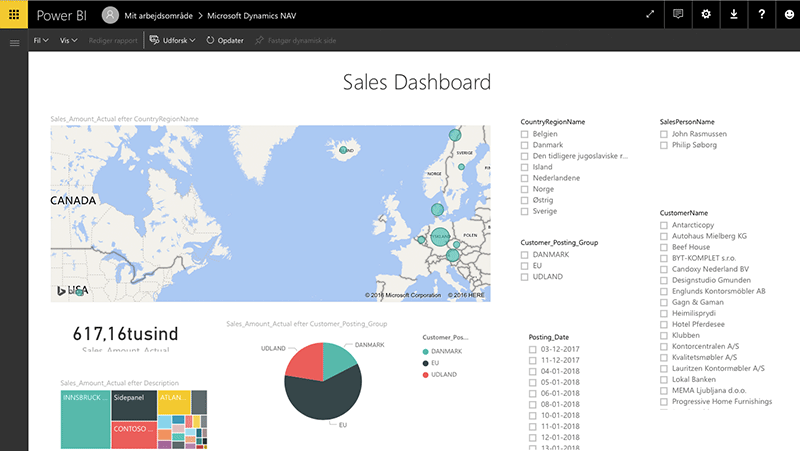
Microsoft Power BI is a tool for visualizing data. In short: Power BI gathers company data and presents it in a clear way in a customized dashboard. Different groups of employees can have different types of dashboards, depending on their job function.

Do you have any questions? - Then send us an email

Ask us about Power BI

Call – or write to us.

Phone: +45 5353 2020

Email: kontakt@vektus.dk

Microsoft Power BI gives you a number of benefits

Bigger and faster overview – with graphical presentation of data

Better decision making – with updated data

Great flexibility – View relevant data on your preferred device (smartphone, tablet, etc.)

Free Power BI Standard Reports in Business Central

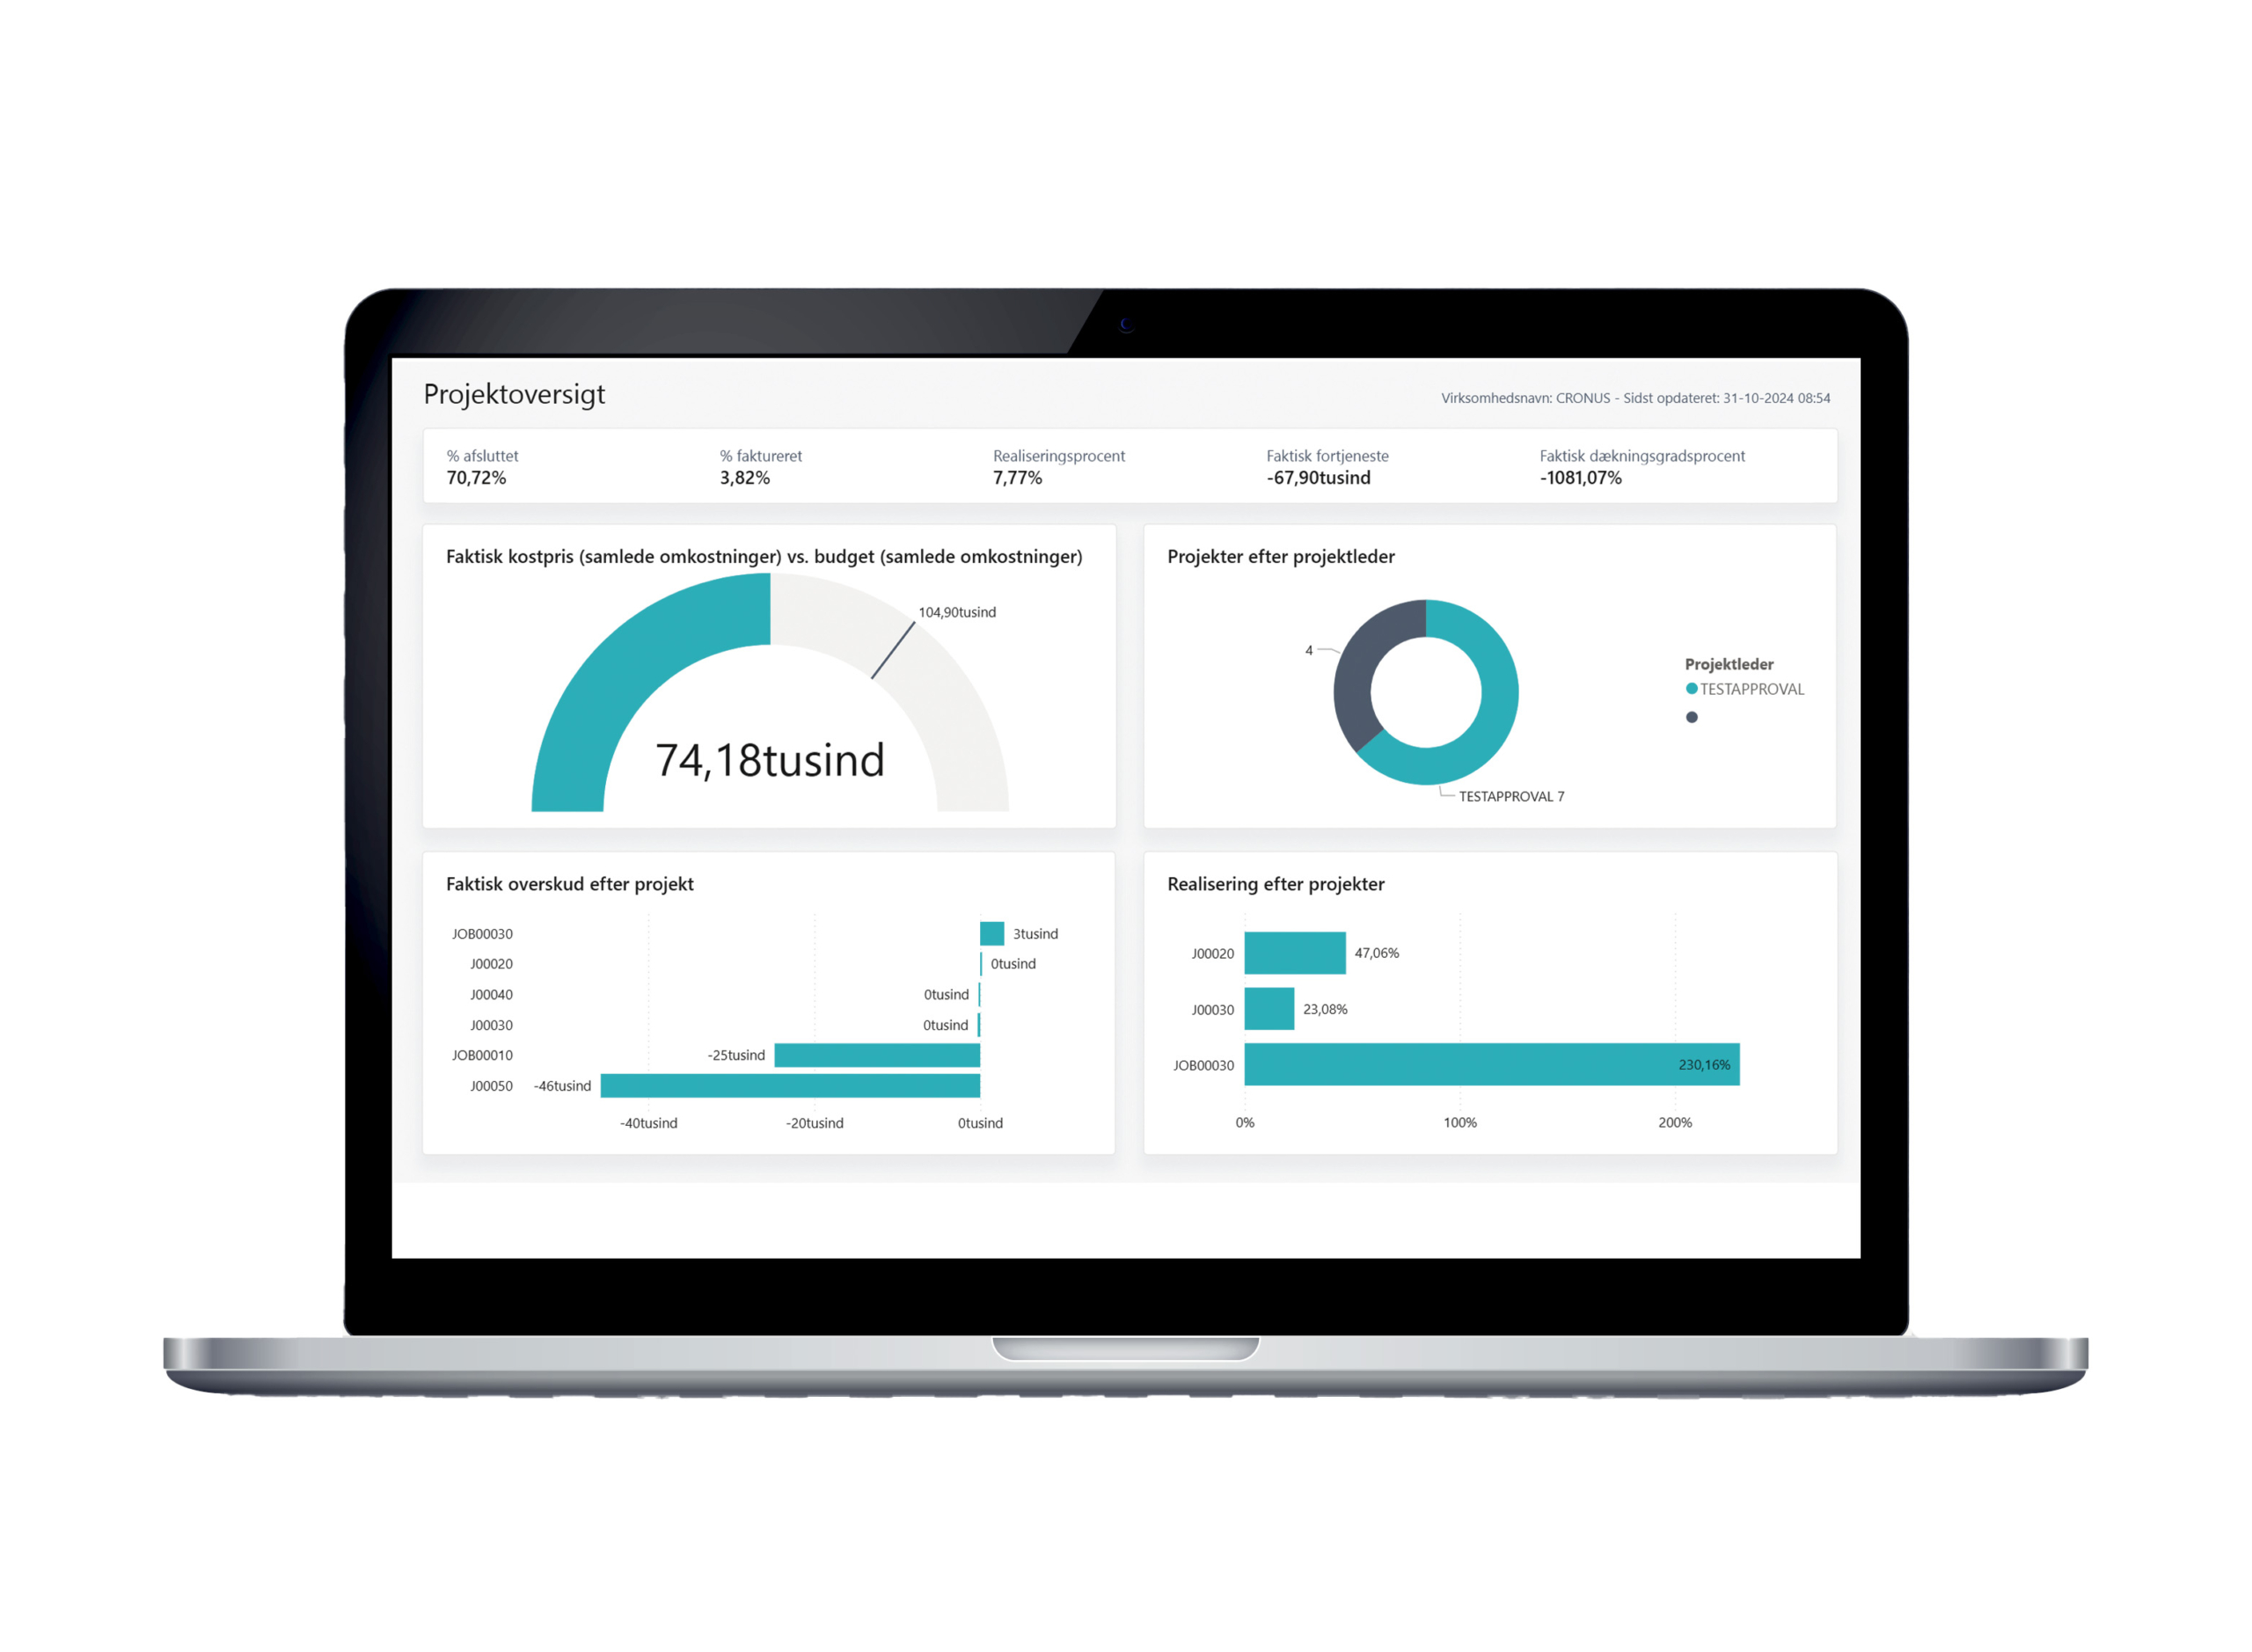
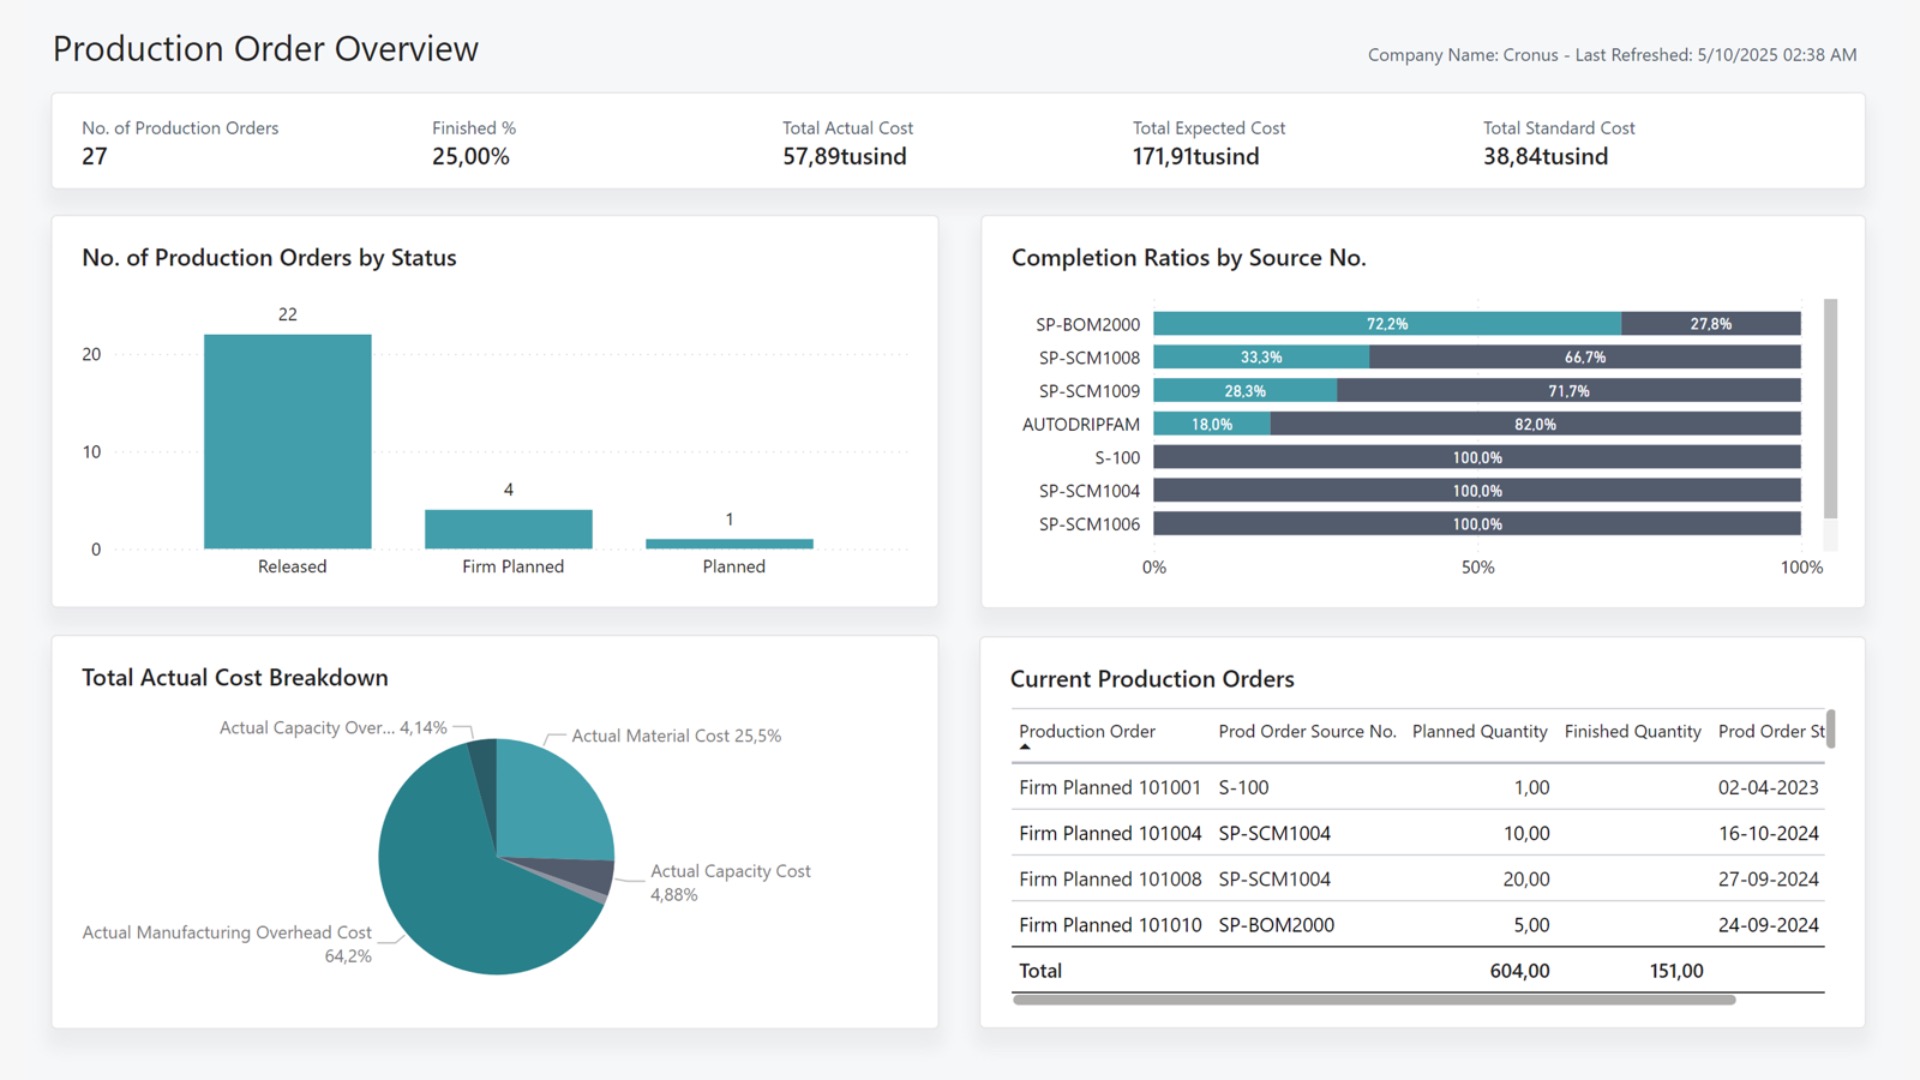
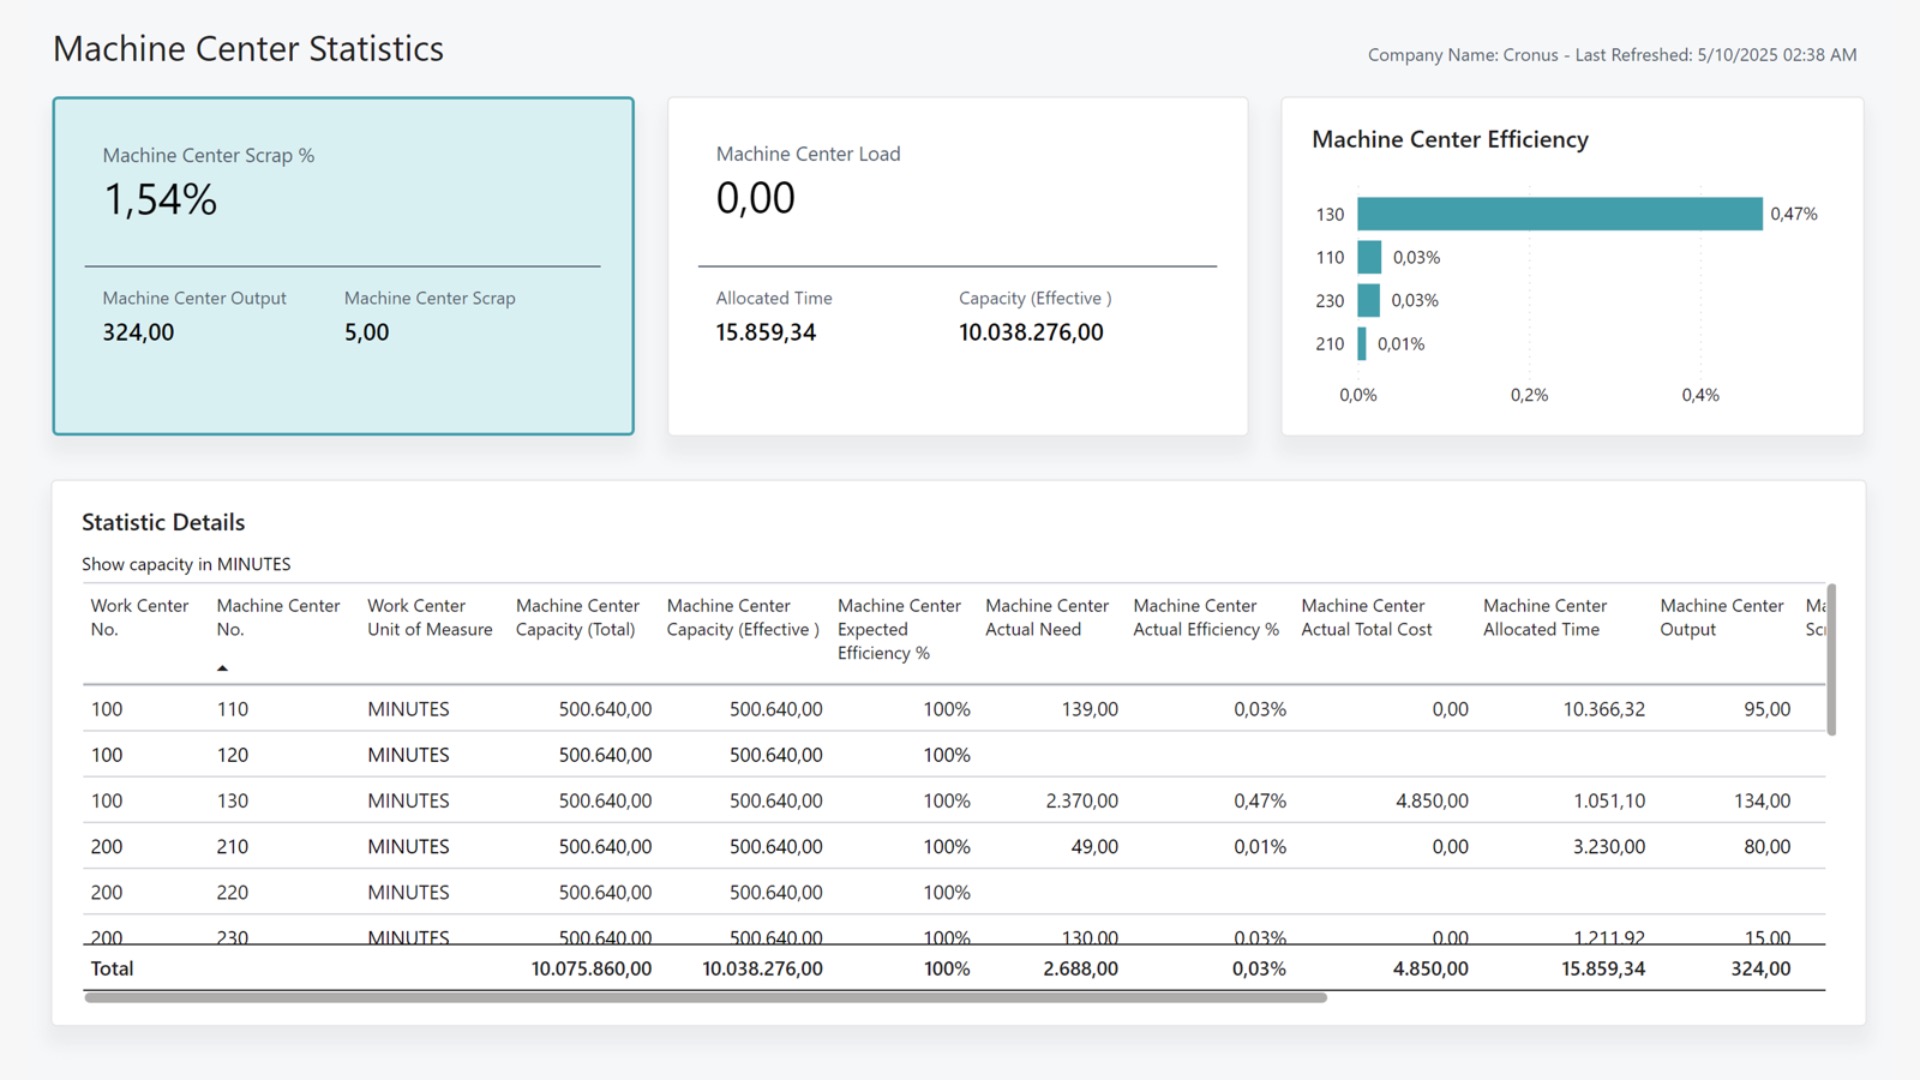
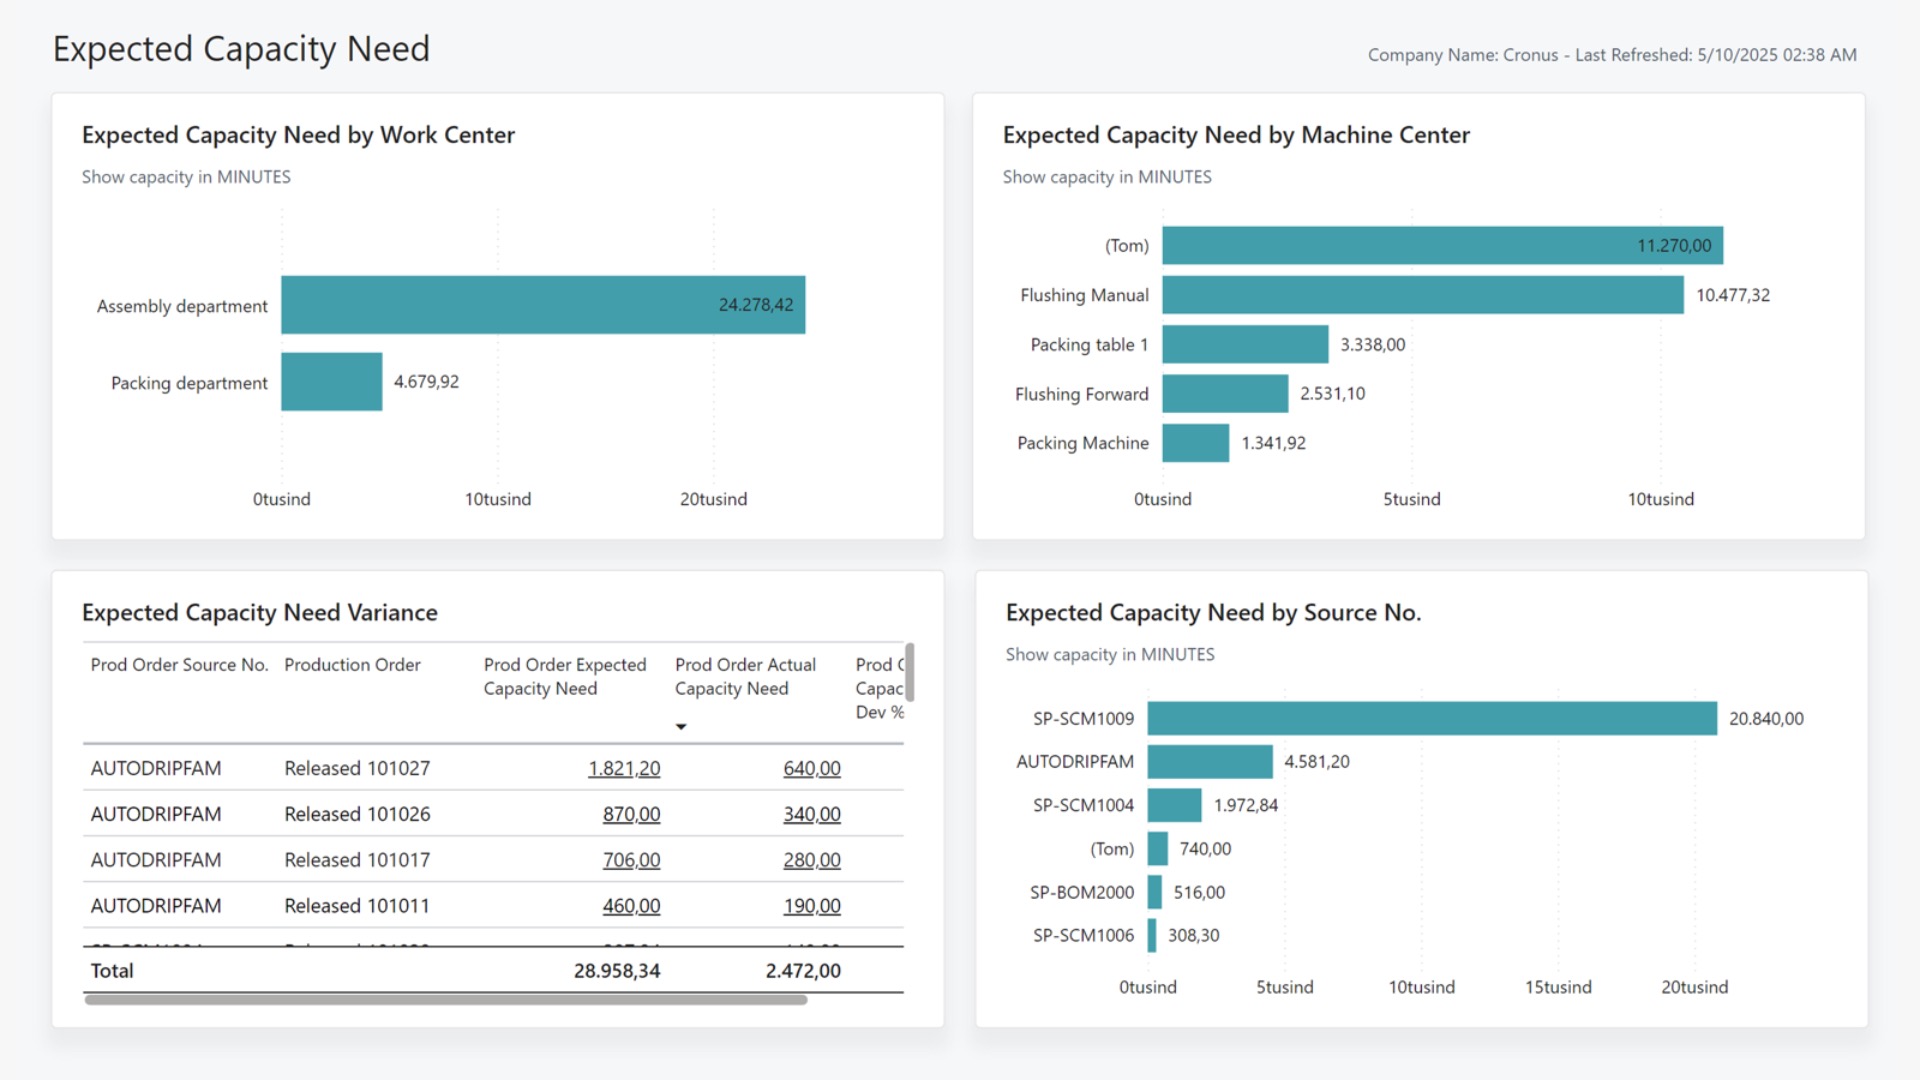
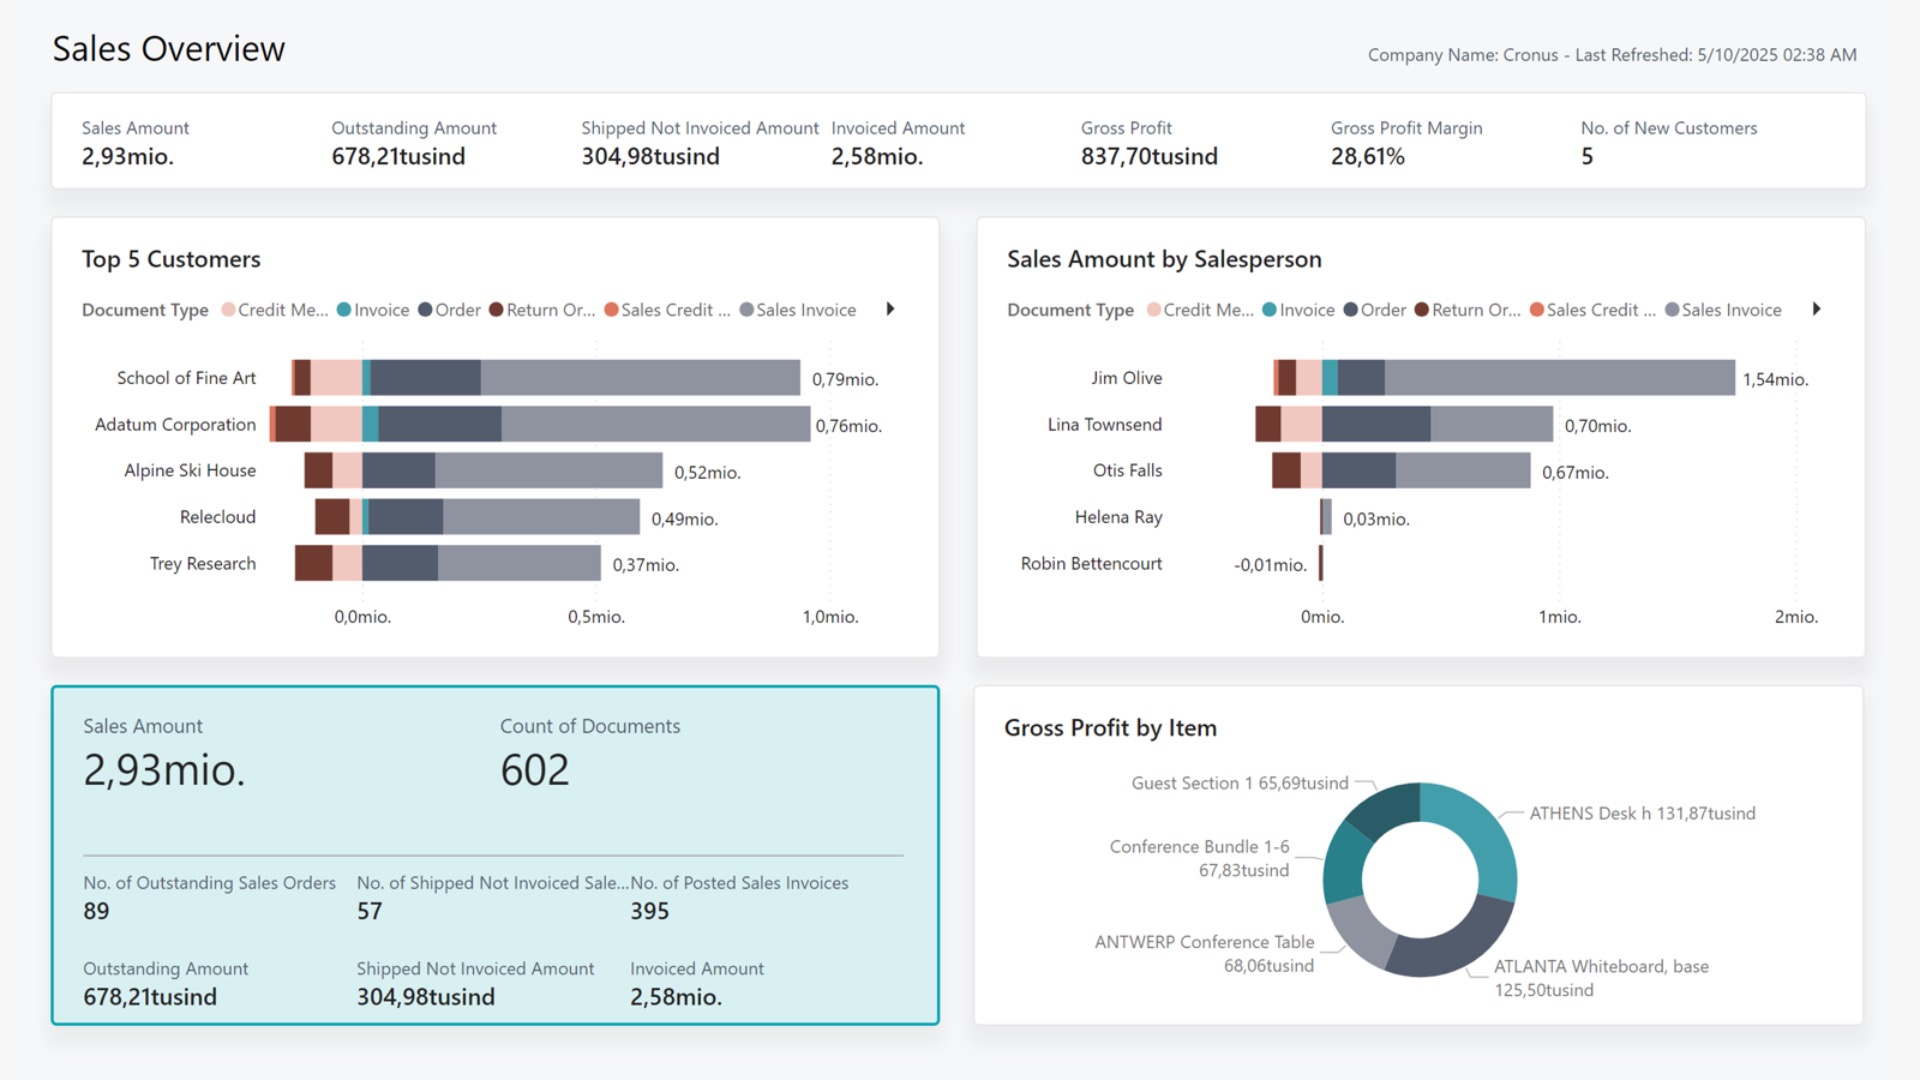
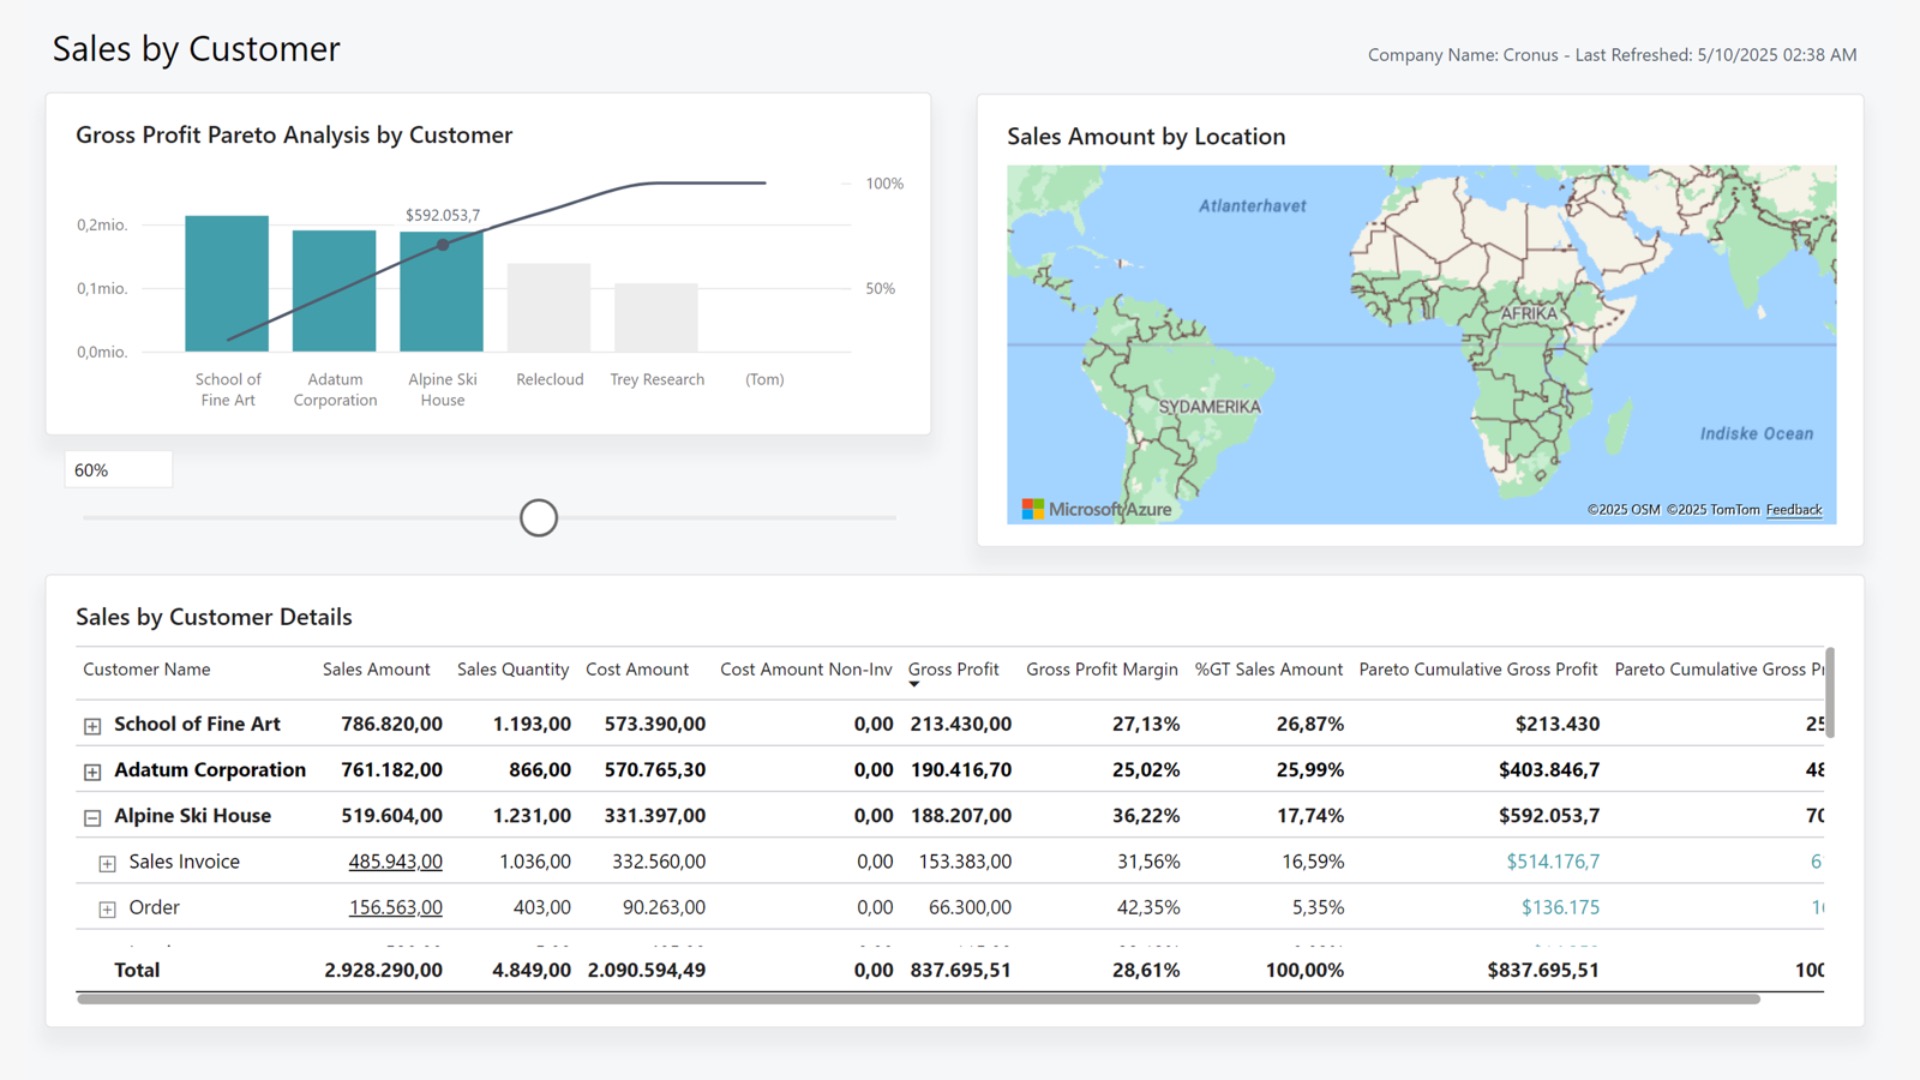
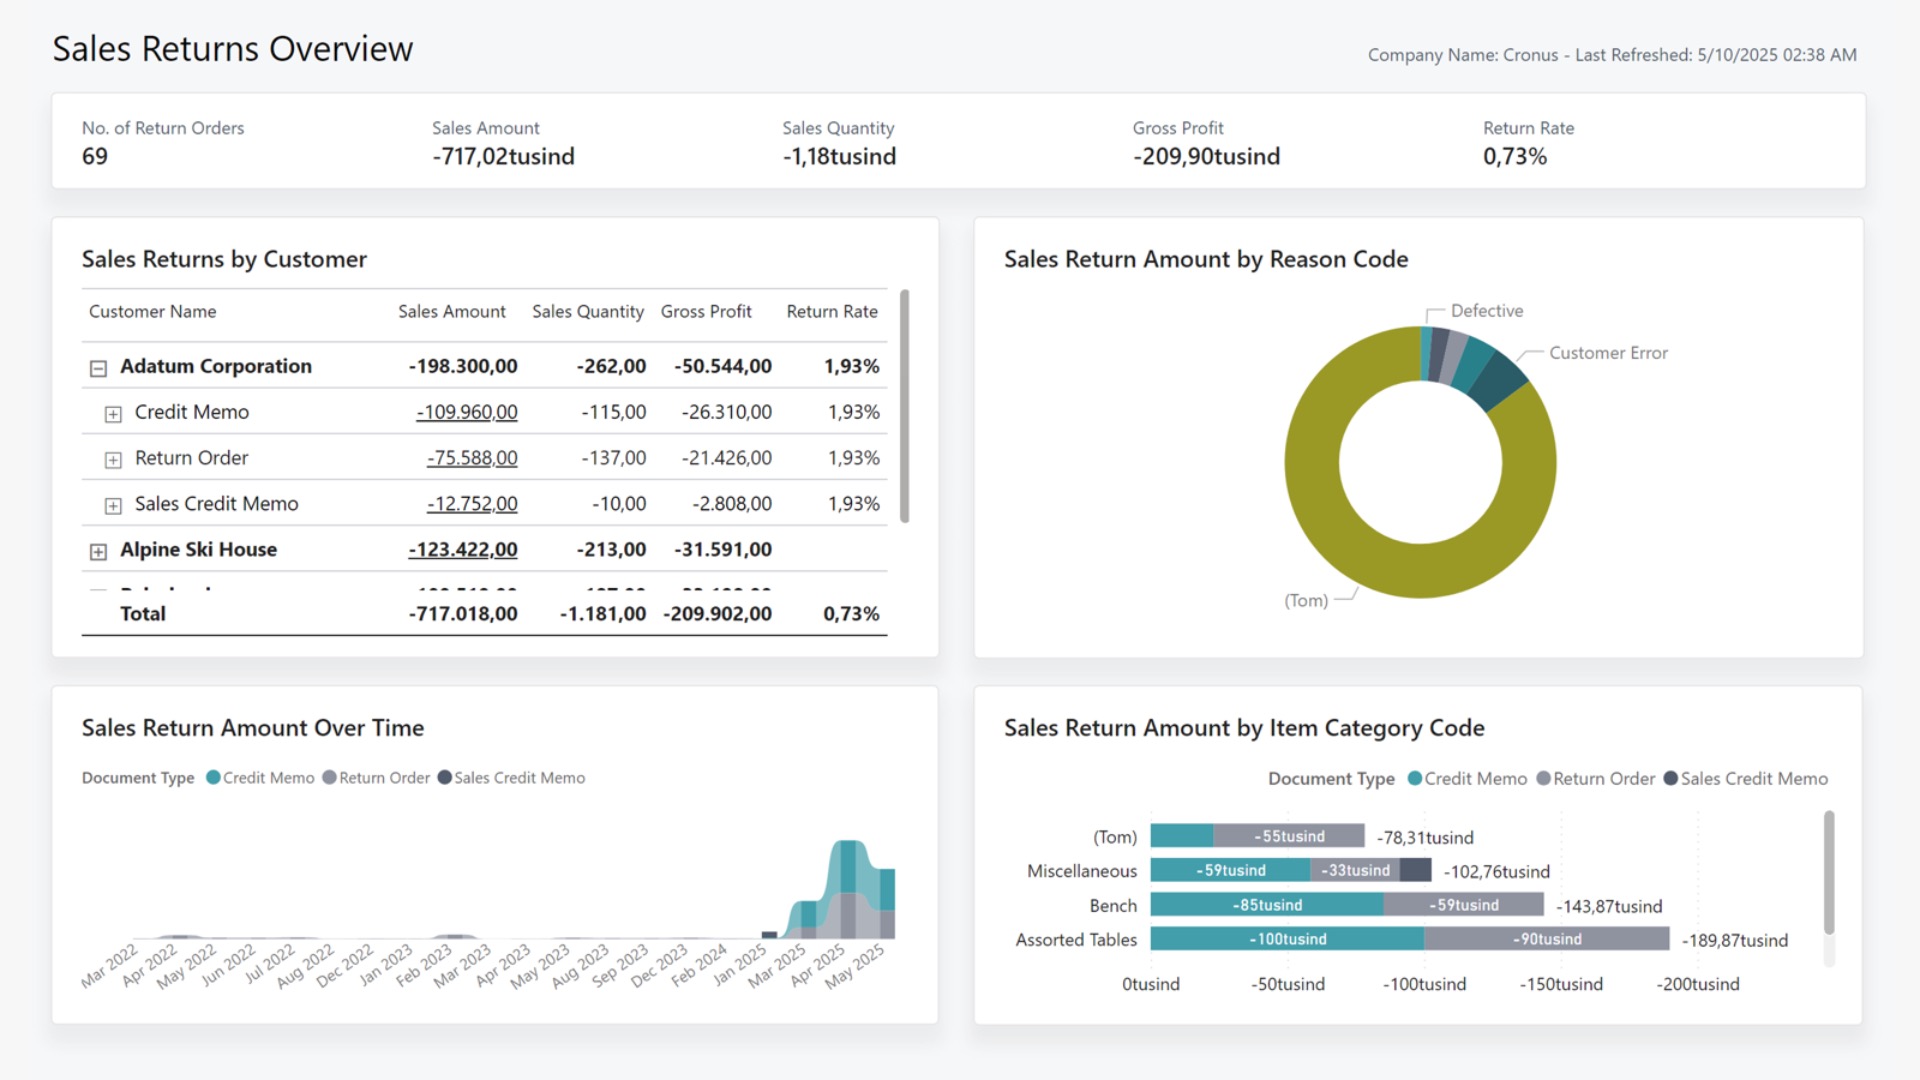
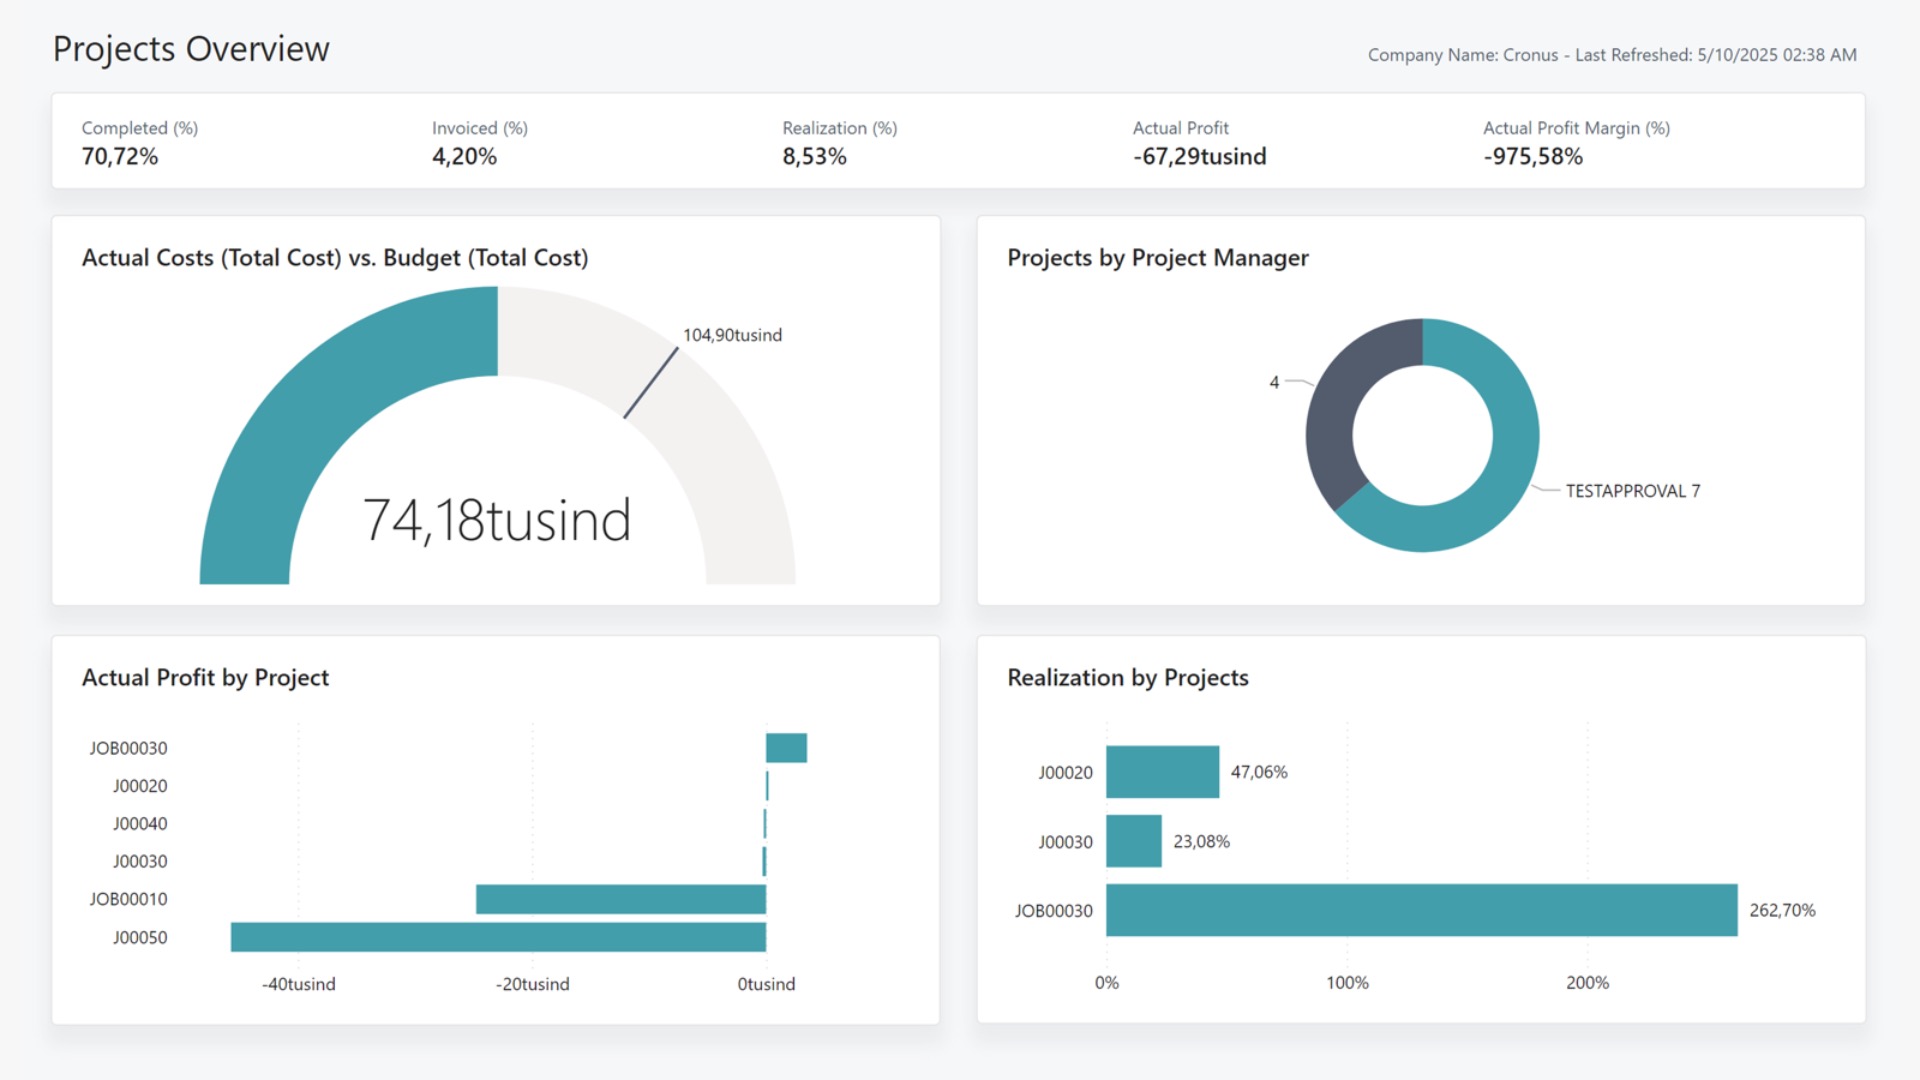
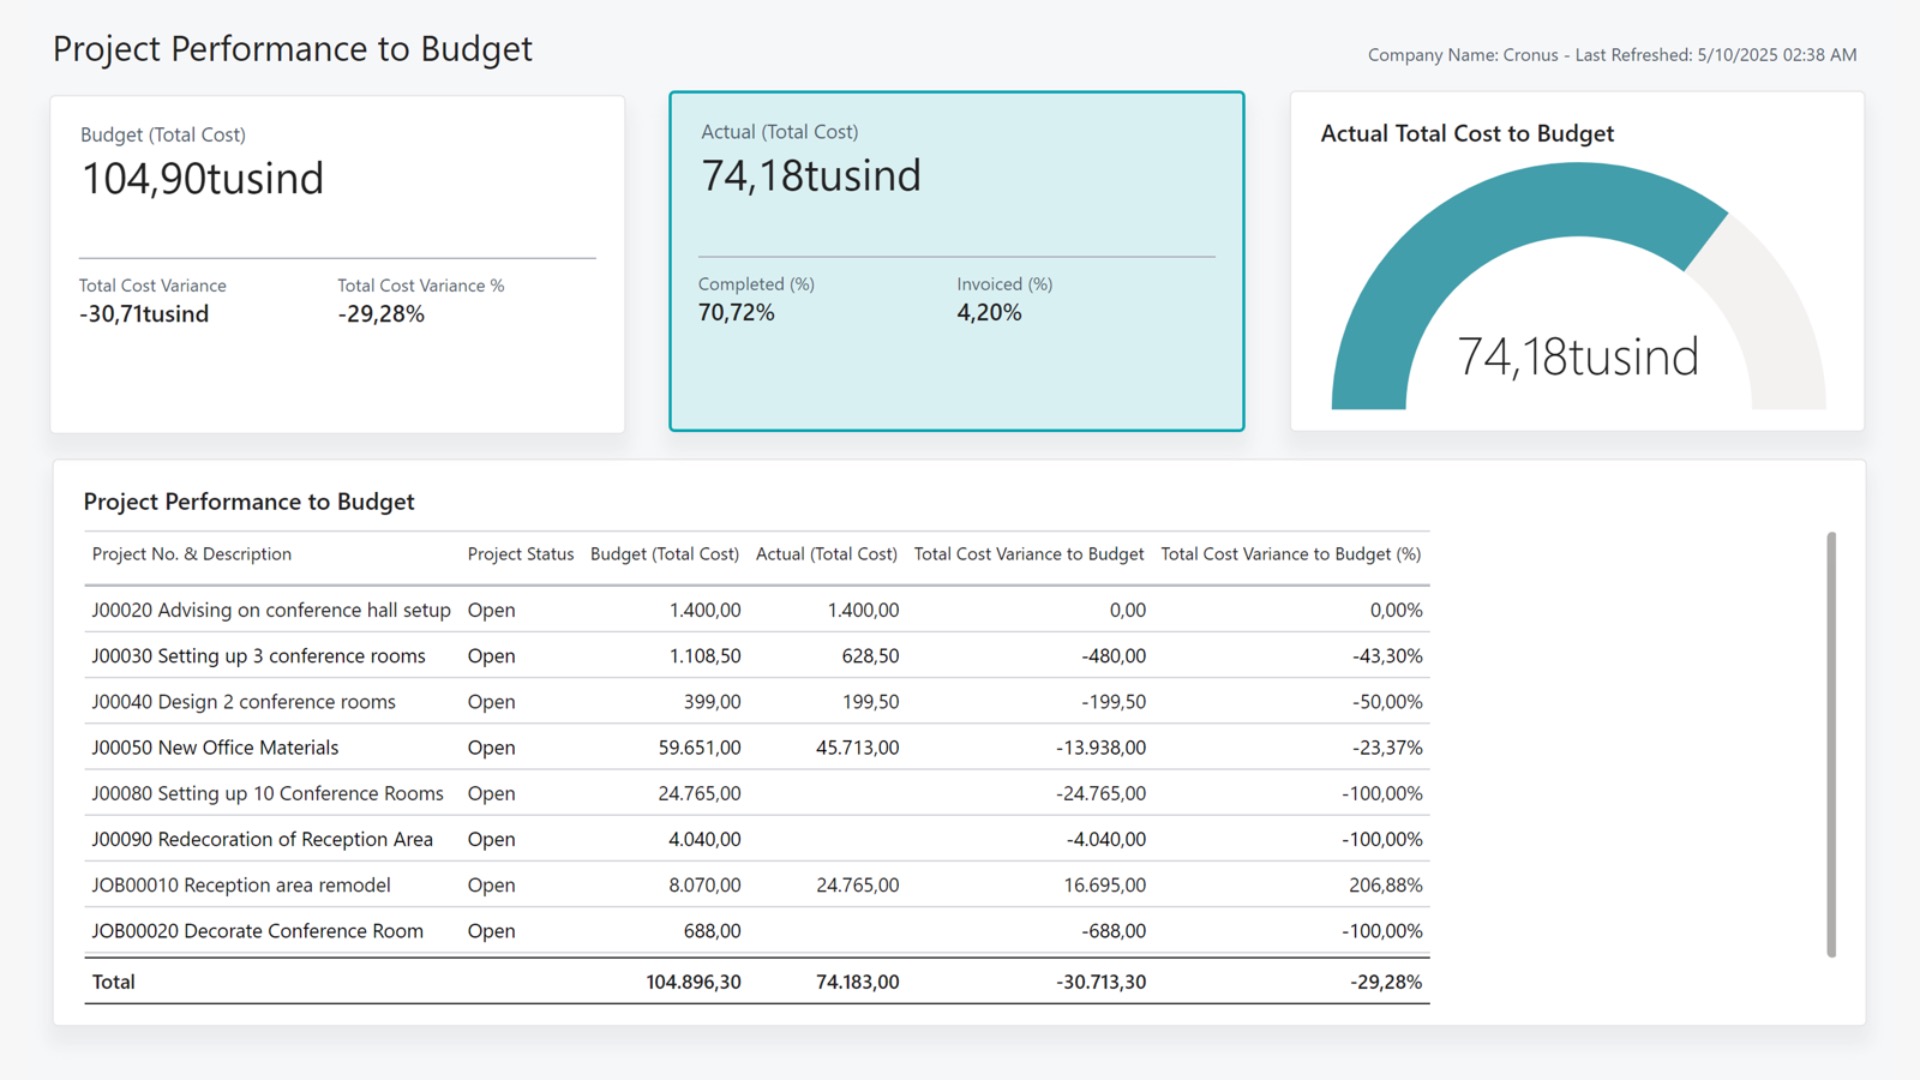
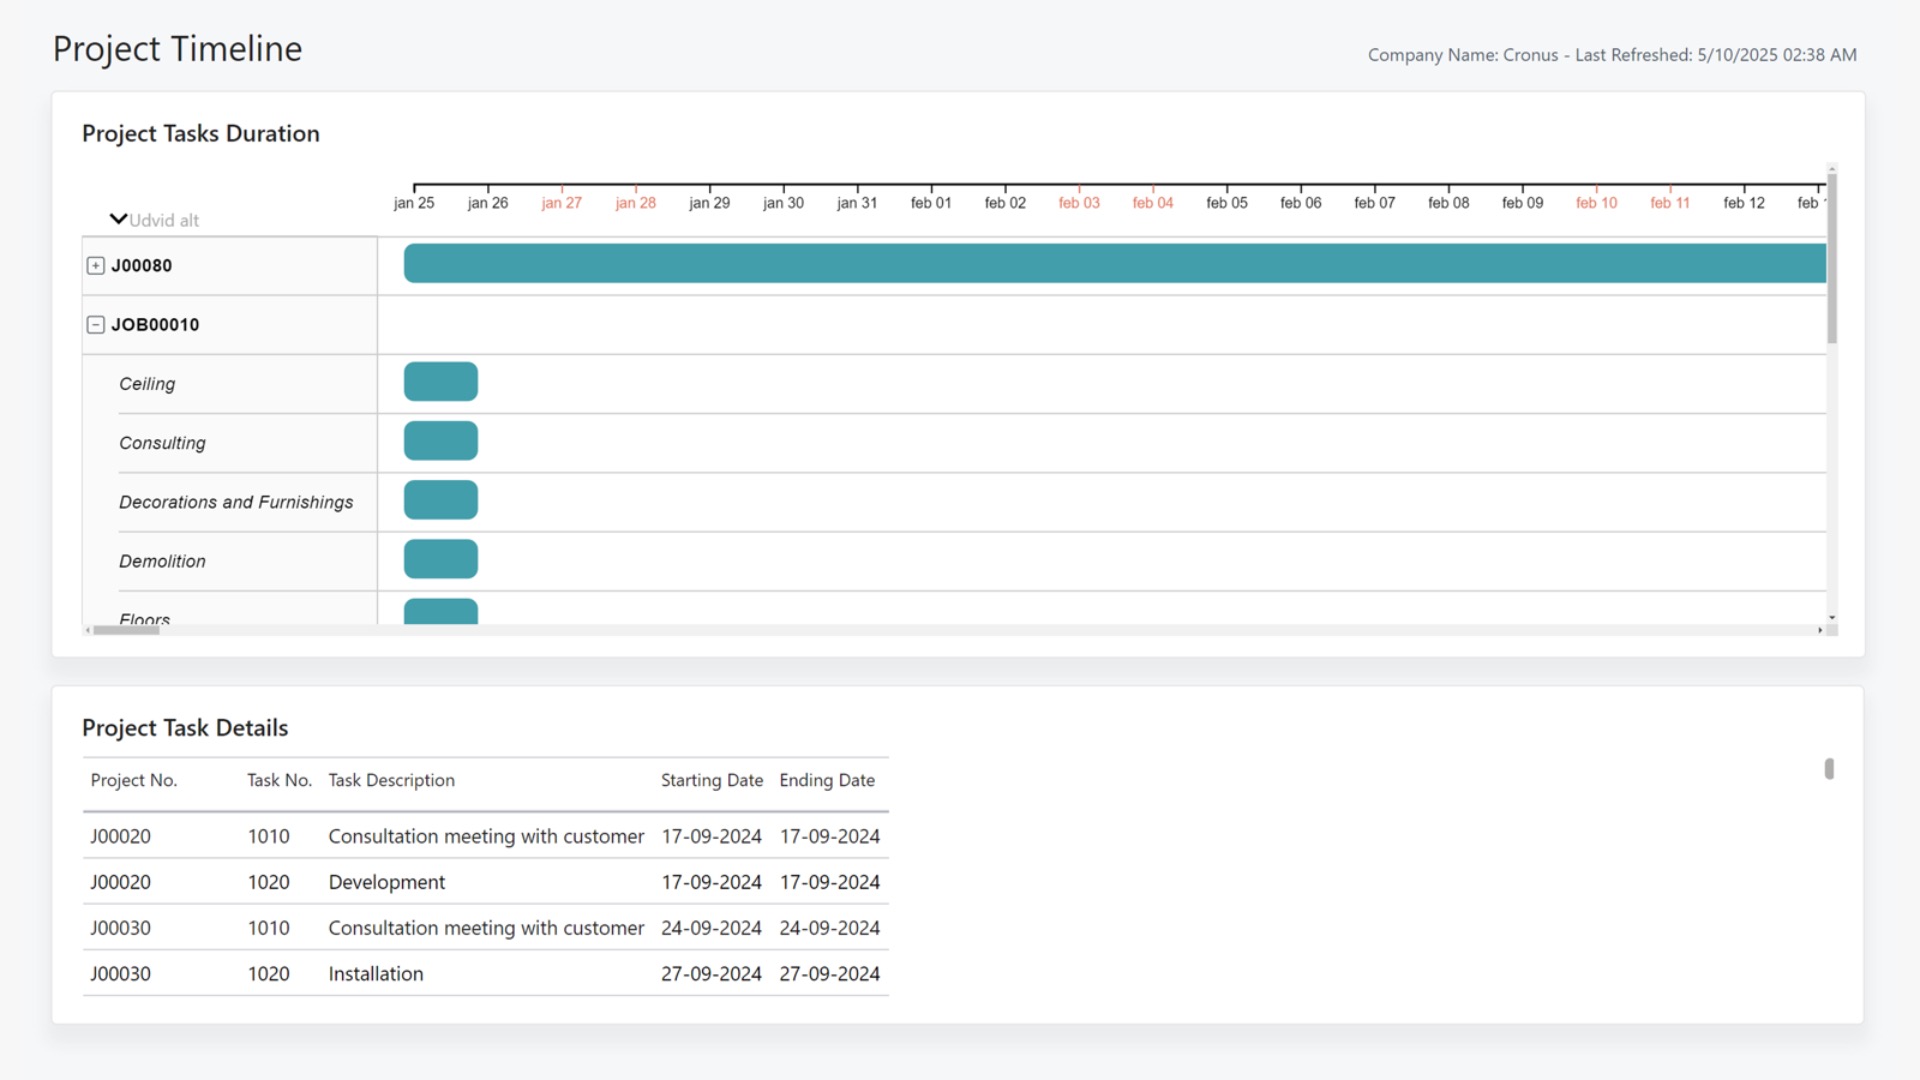
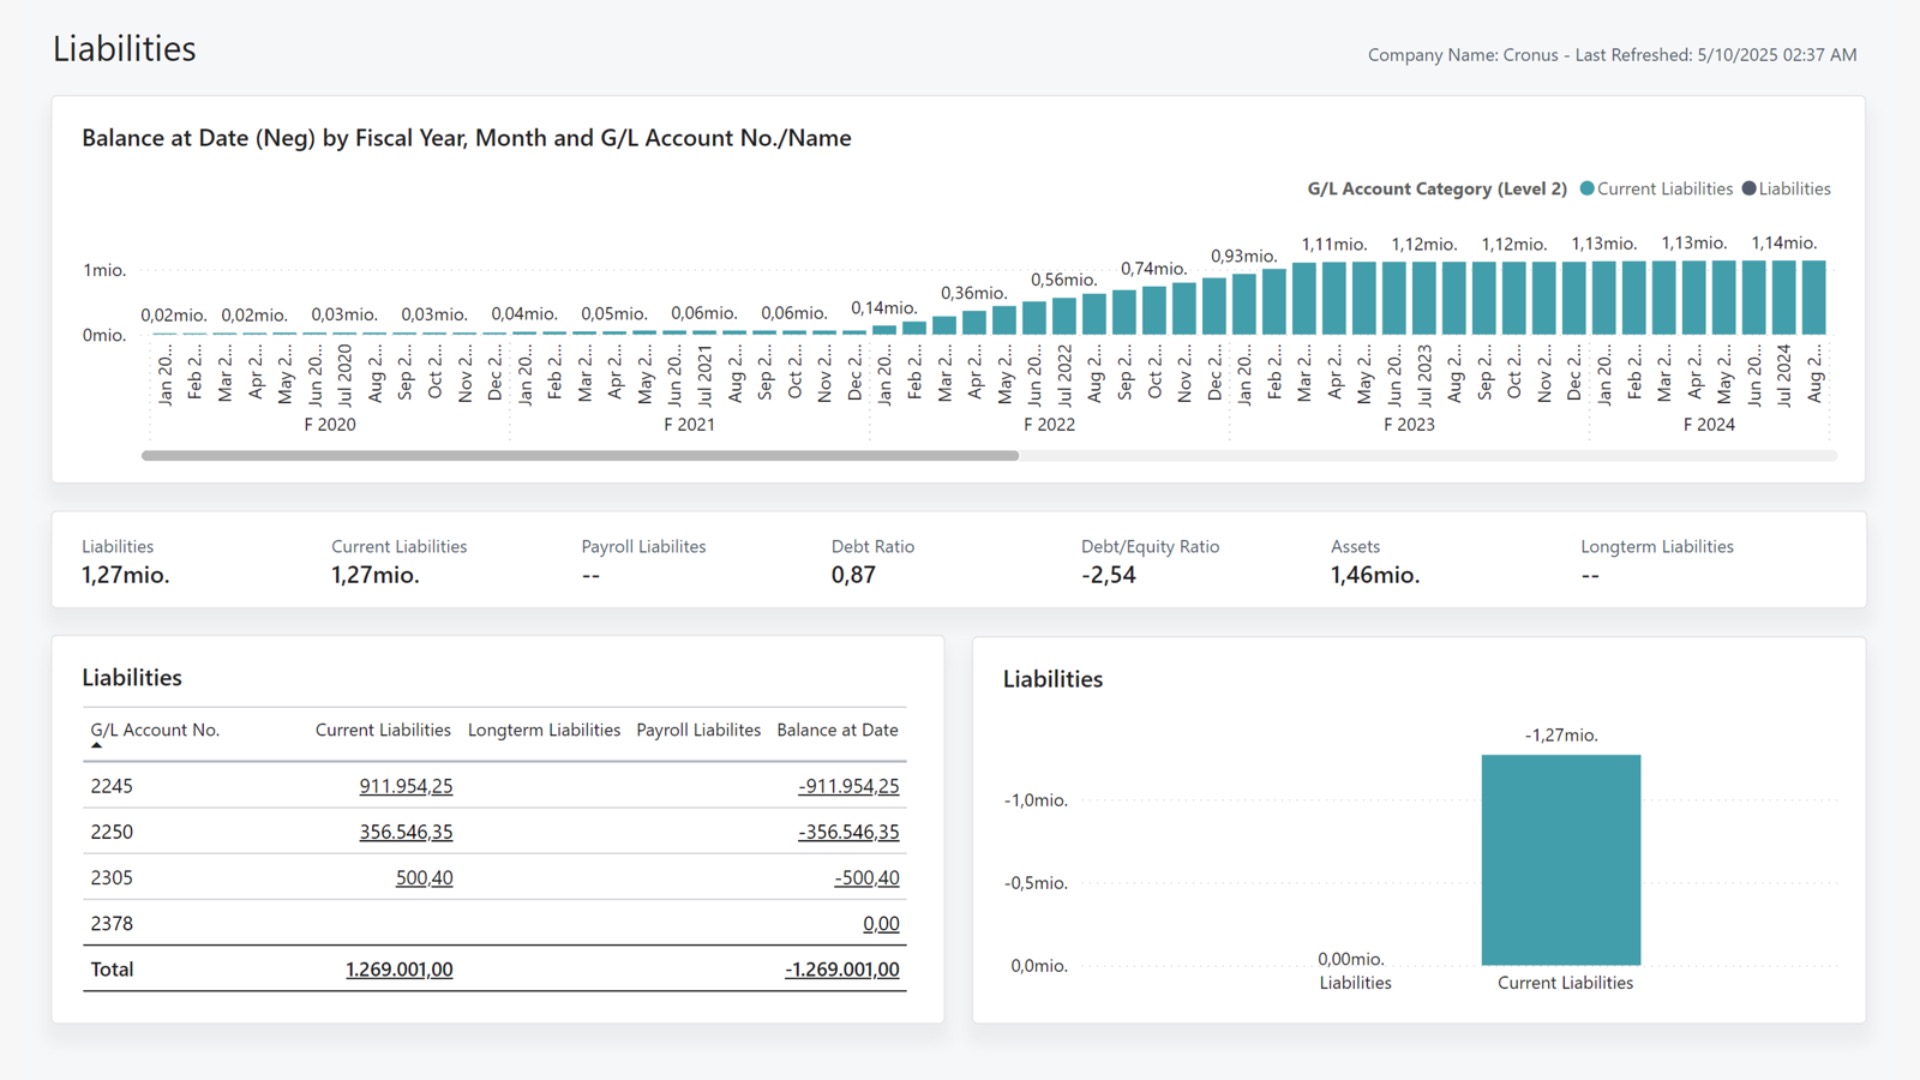
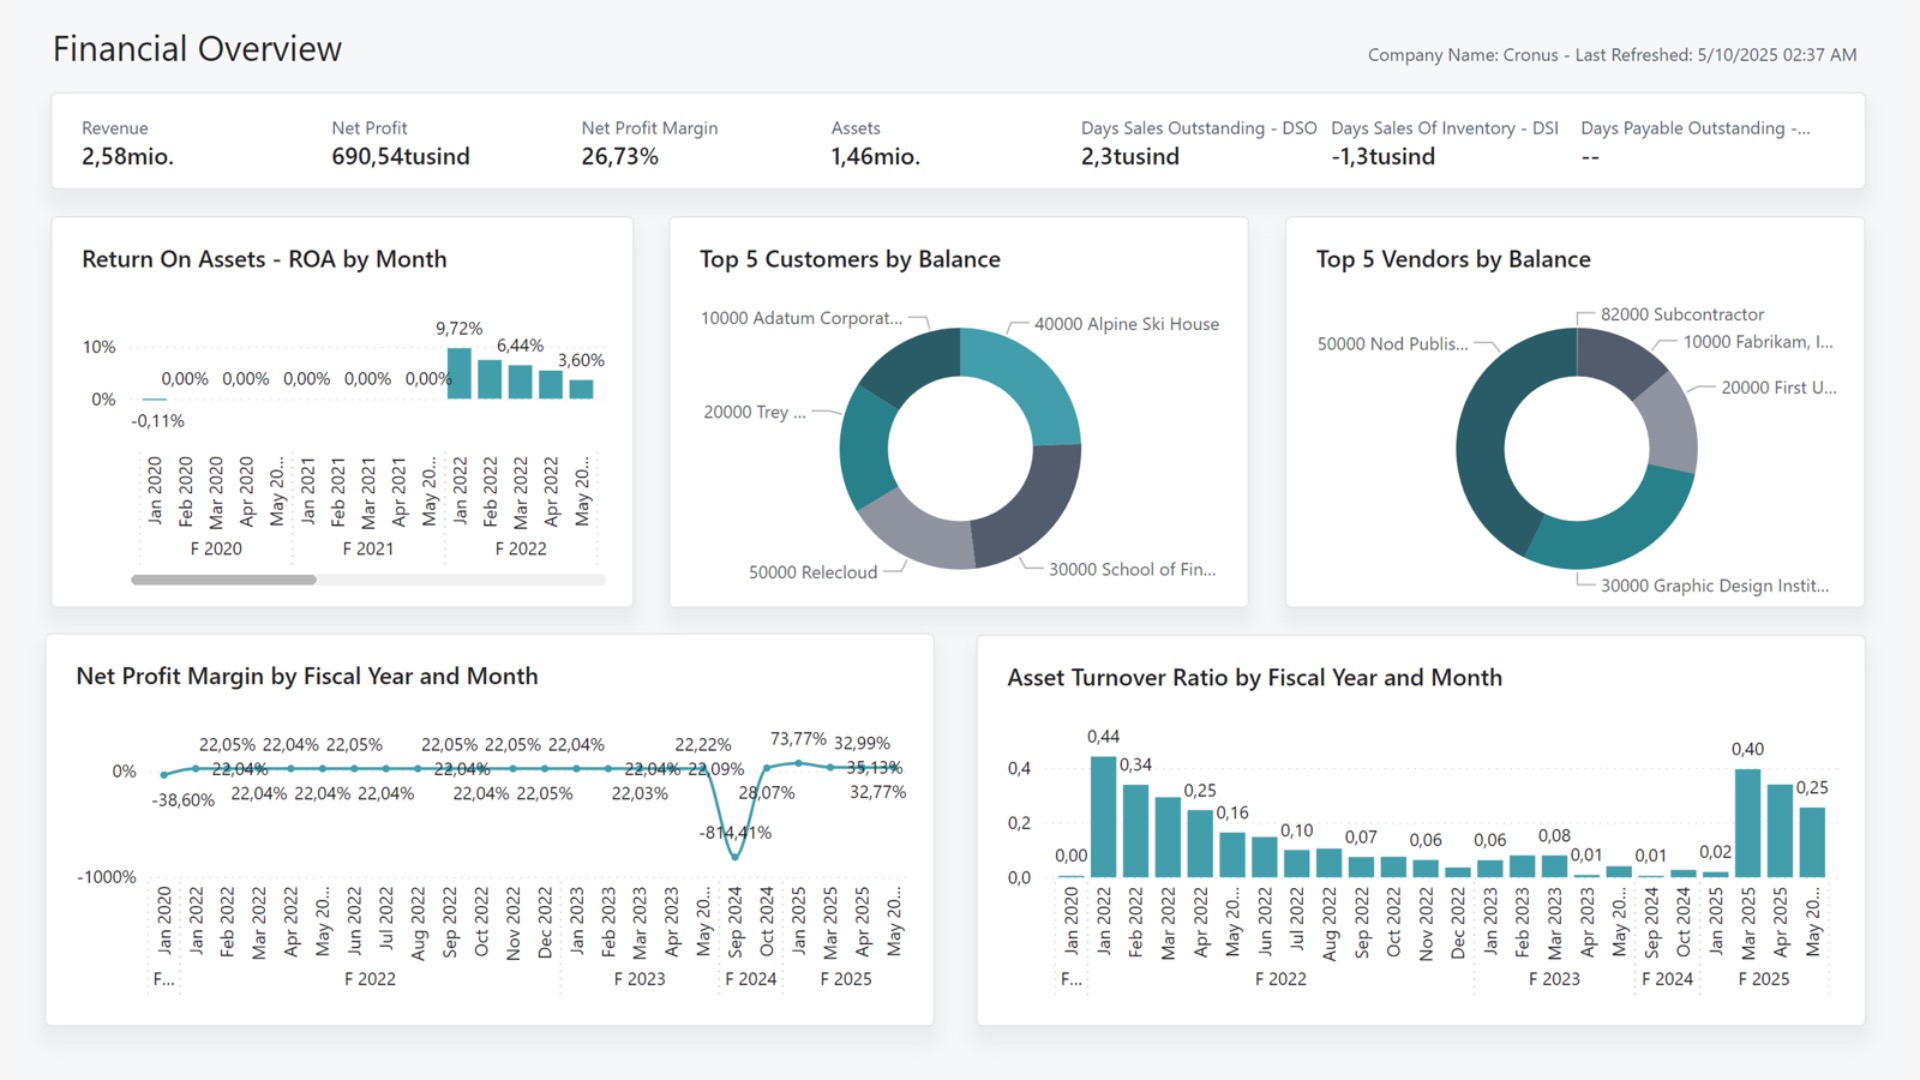
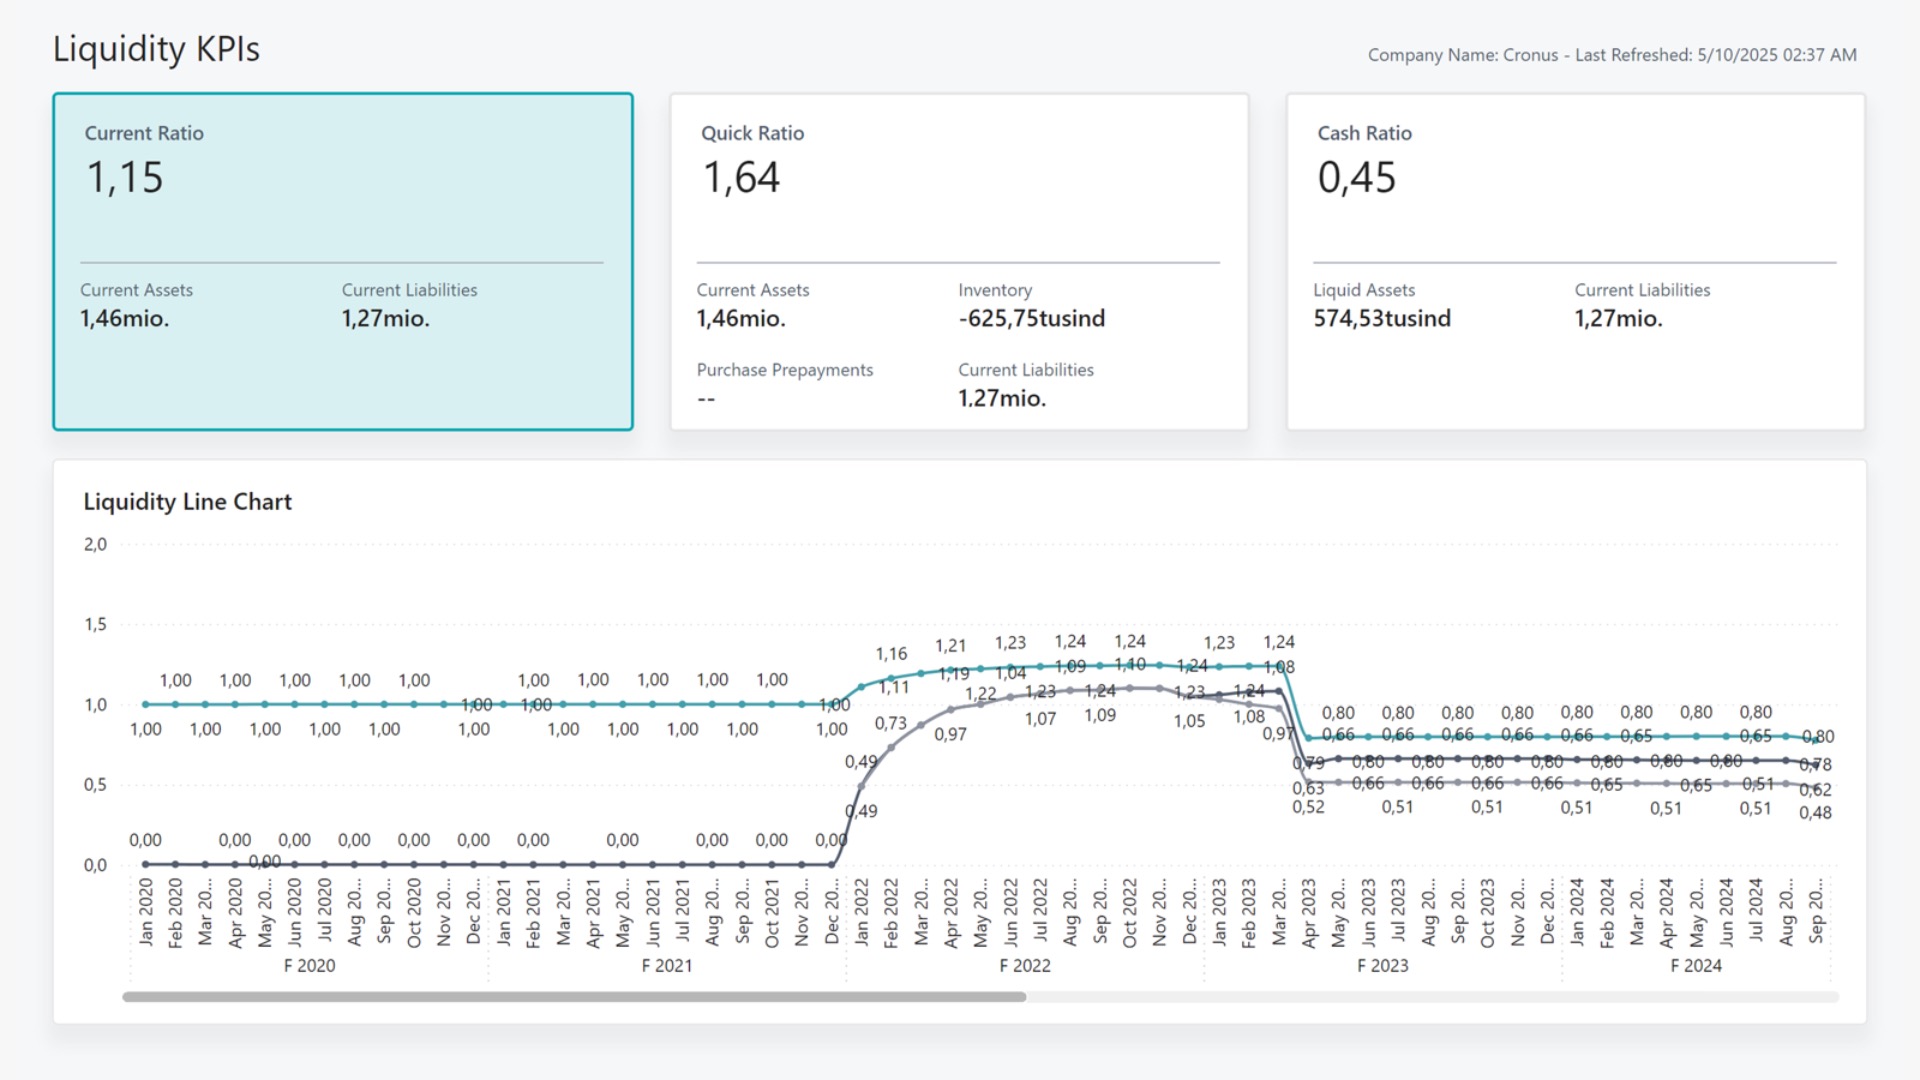
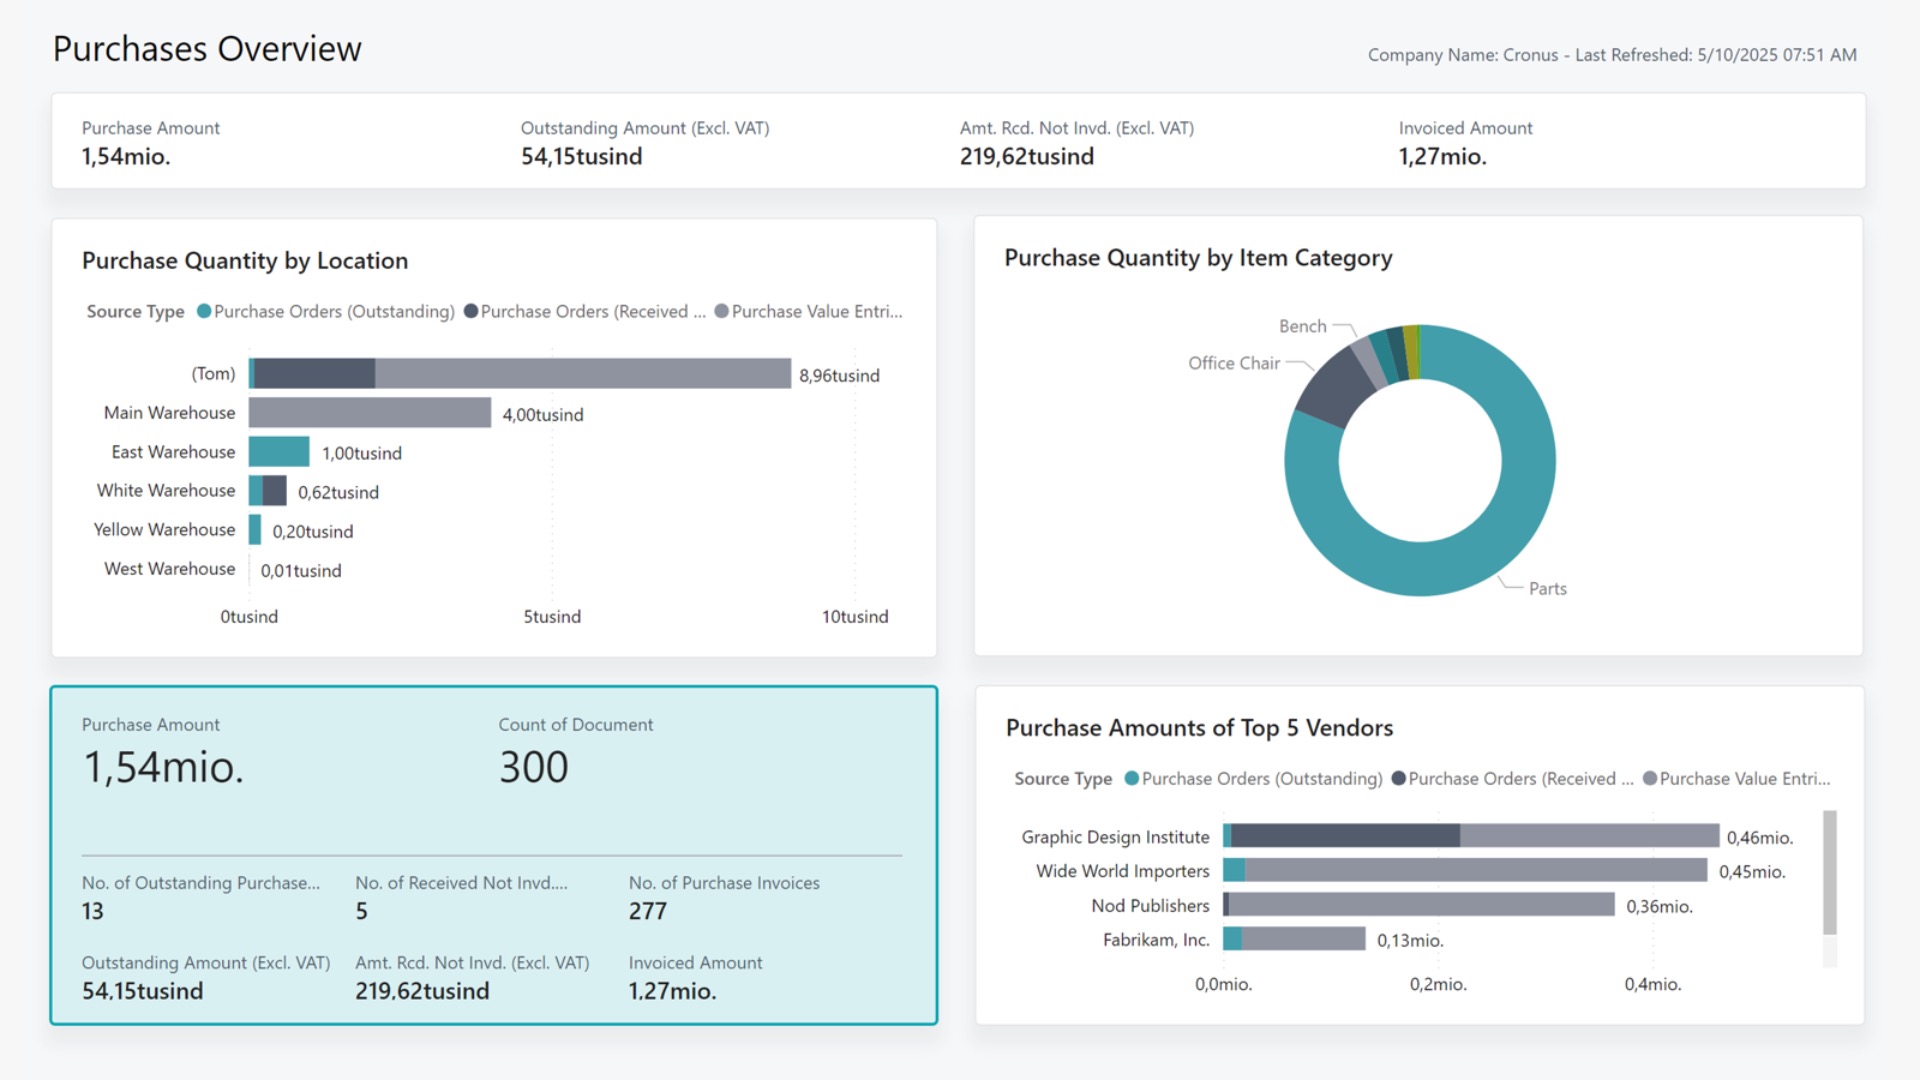
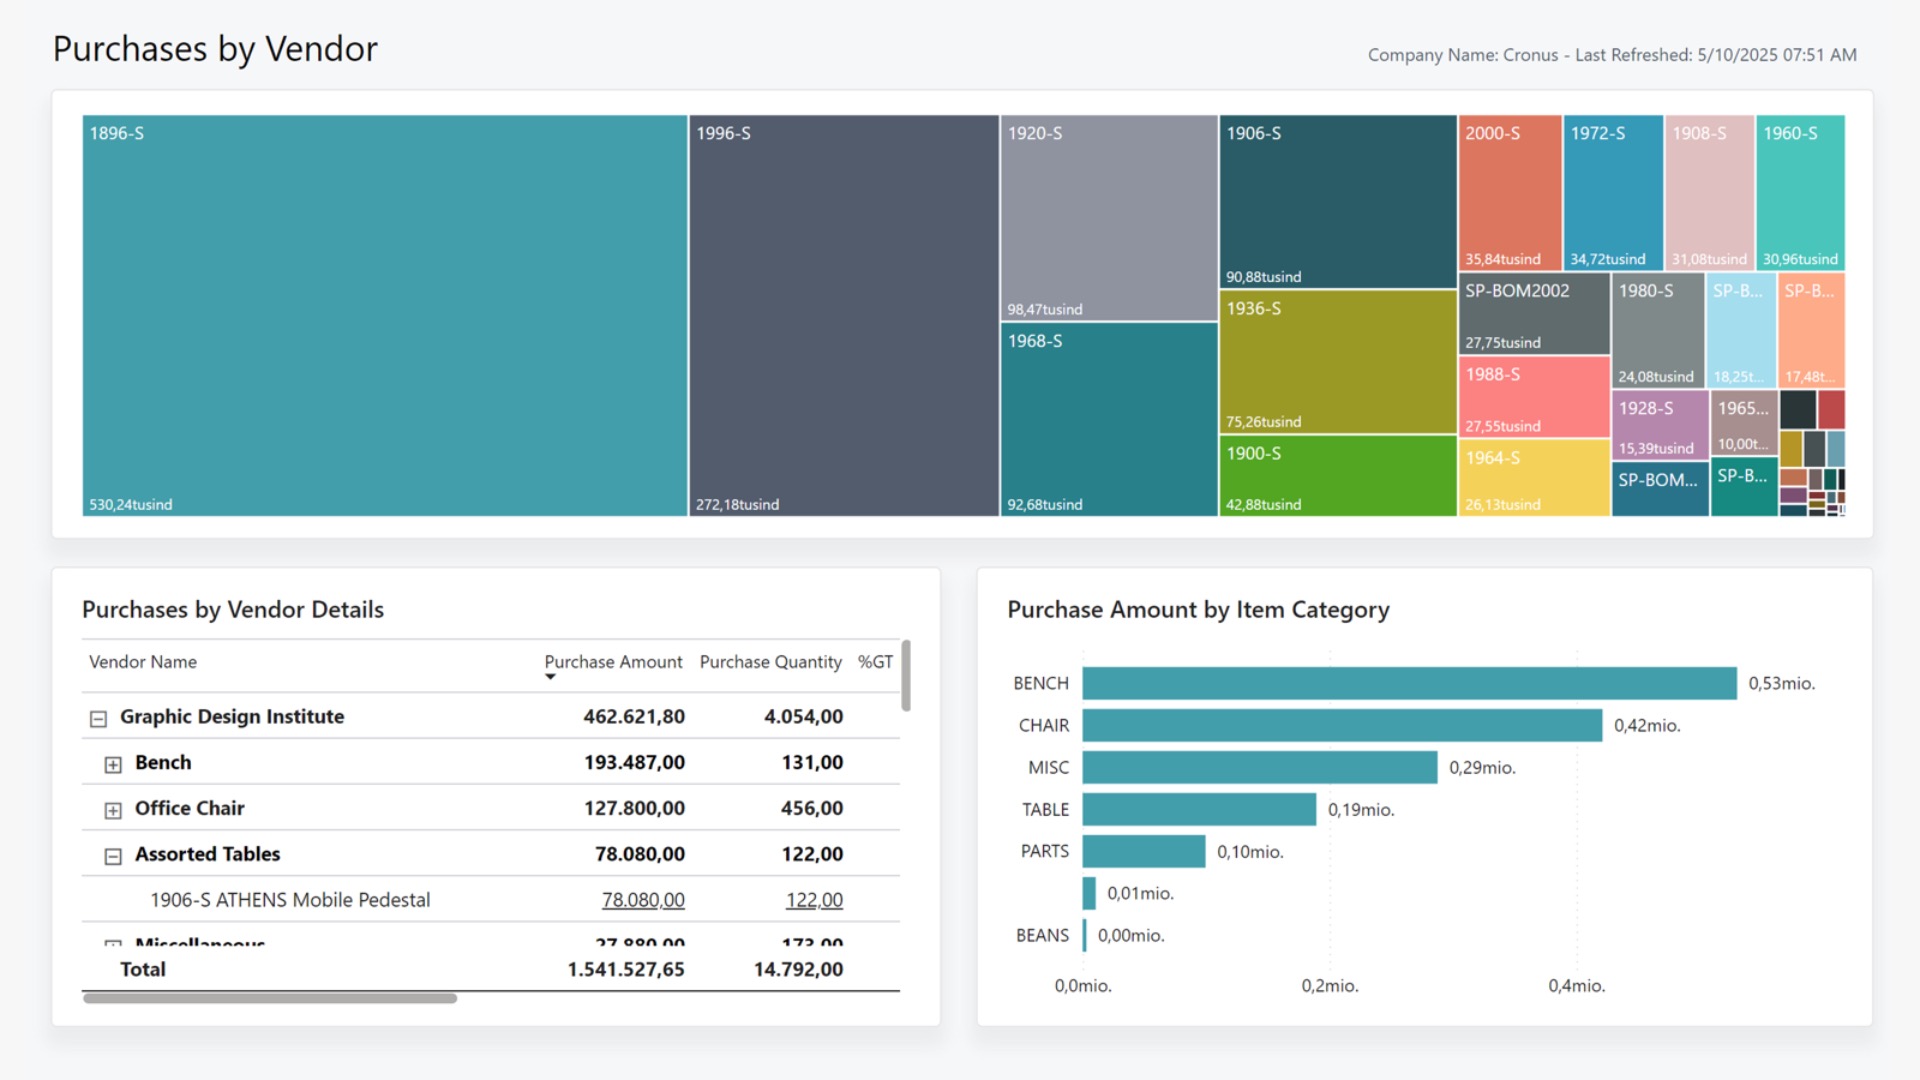
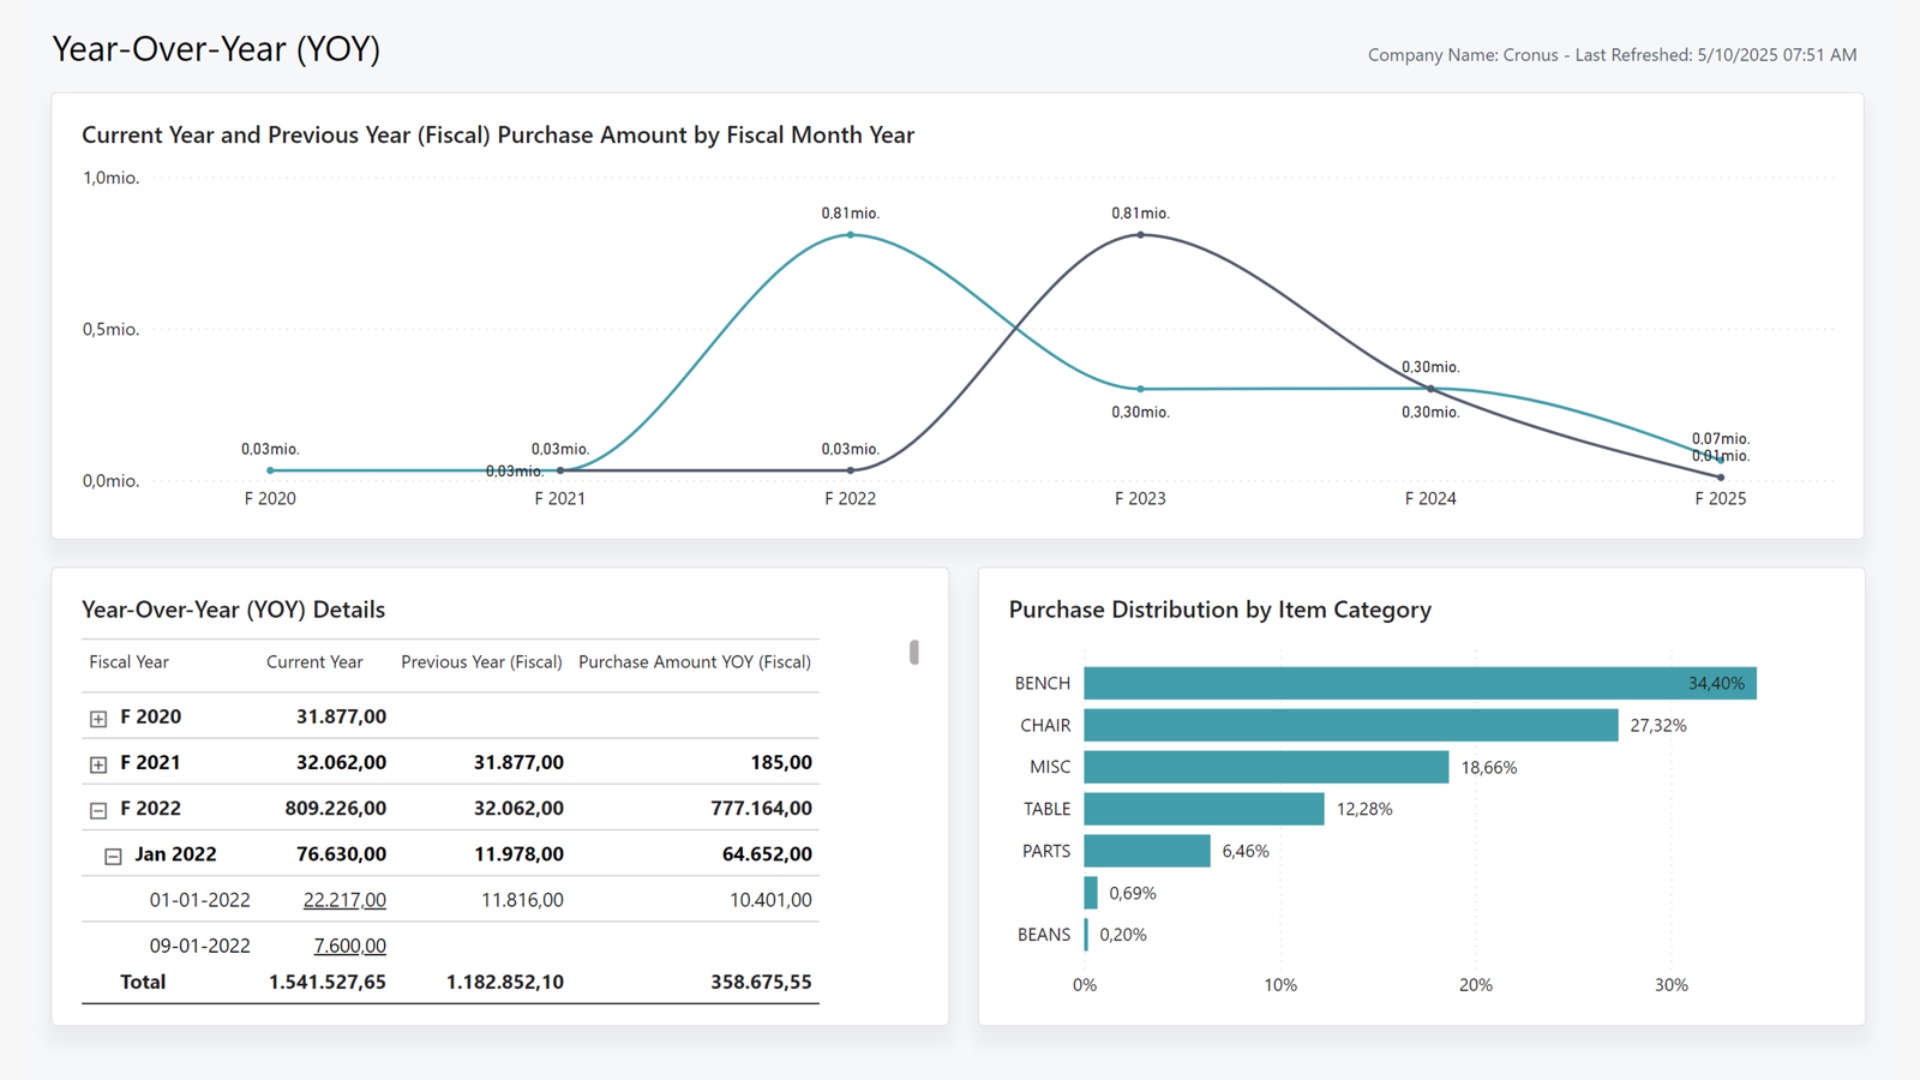
Microsoft currently offers several free standard reports that can be imported directly into Business Central—with absolutely no coding required. The reports are created by Microsoft and designed to provide you with valuable insights into your own data directly in Business Central.

Right now, there are over 70 different reports—and more are being added all the time:

  • 19 financial reports
  • 12 sales reports
  • 14 procurement reports
  • 12 inventory reports
  • 12 production reports
  • 8 project reports

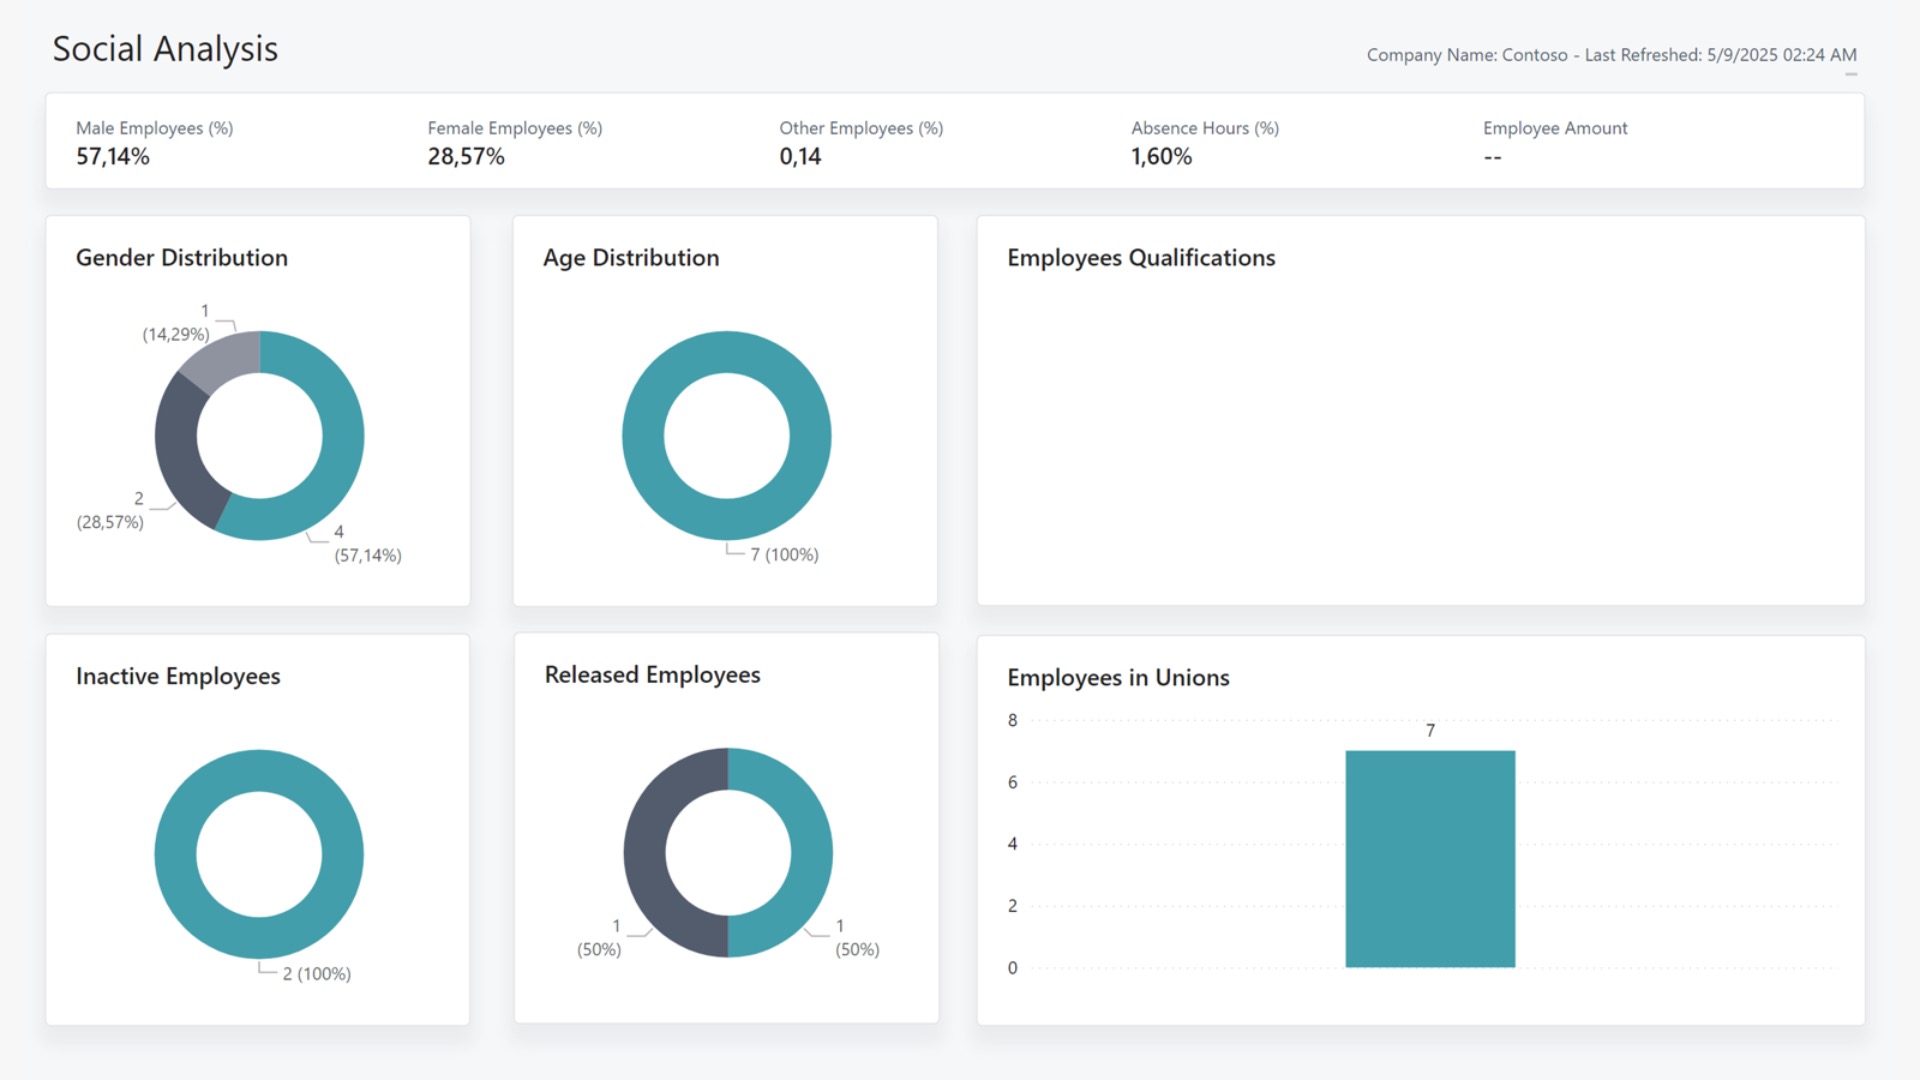
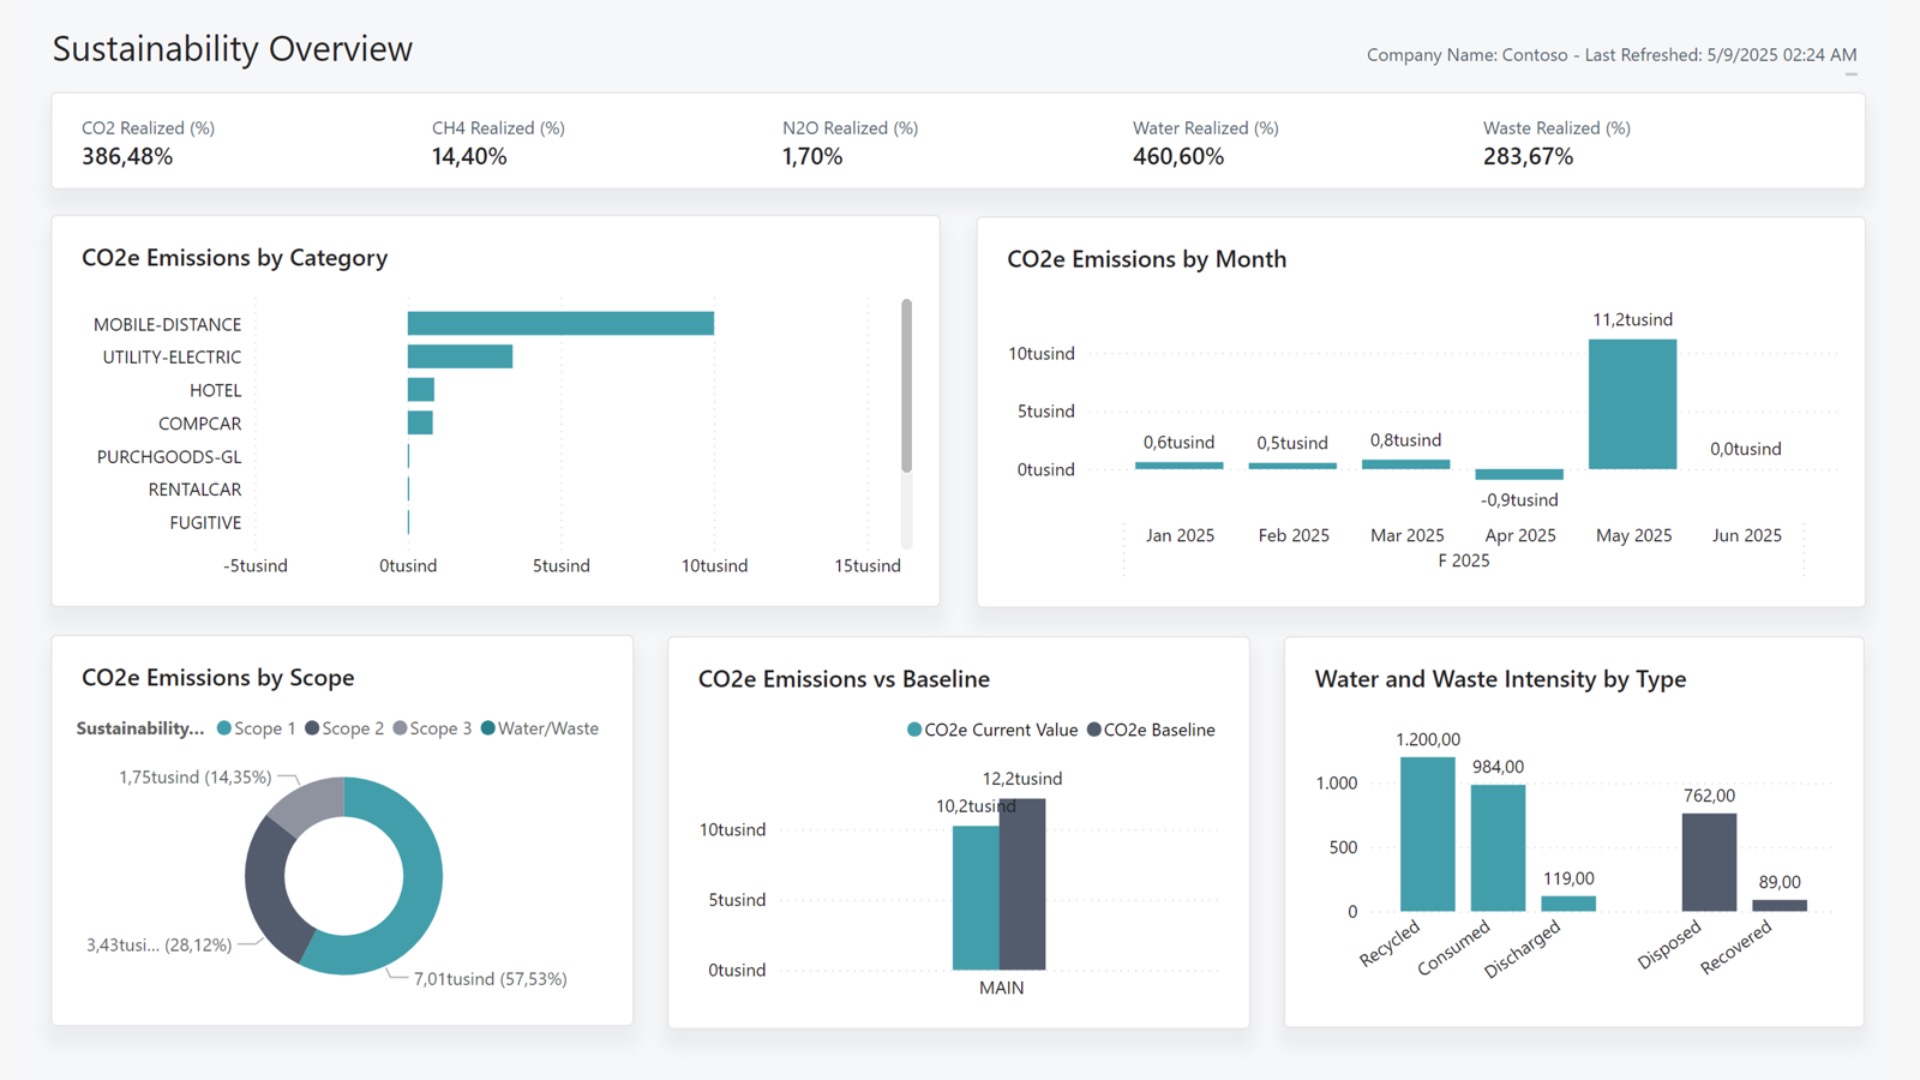
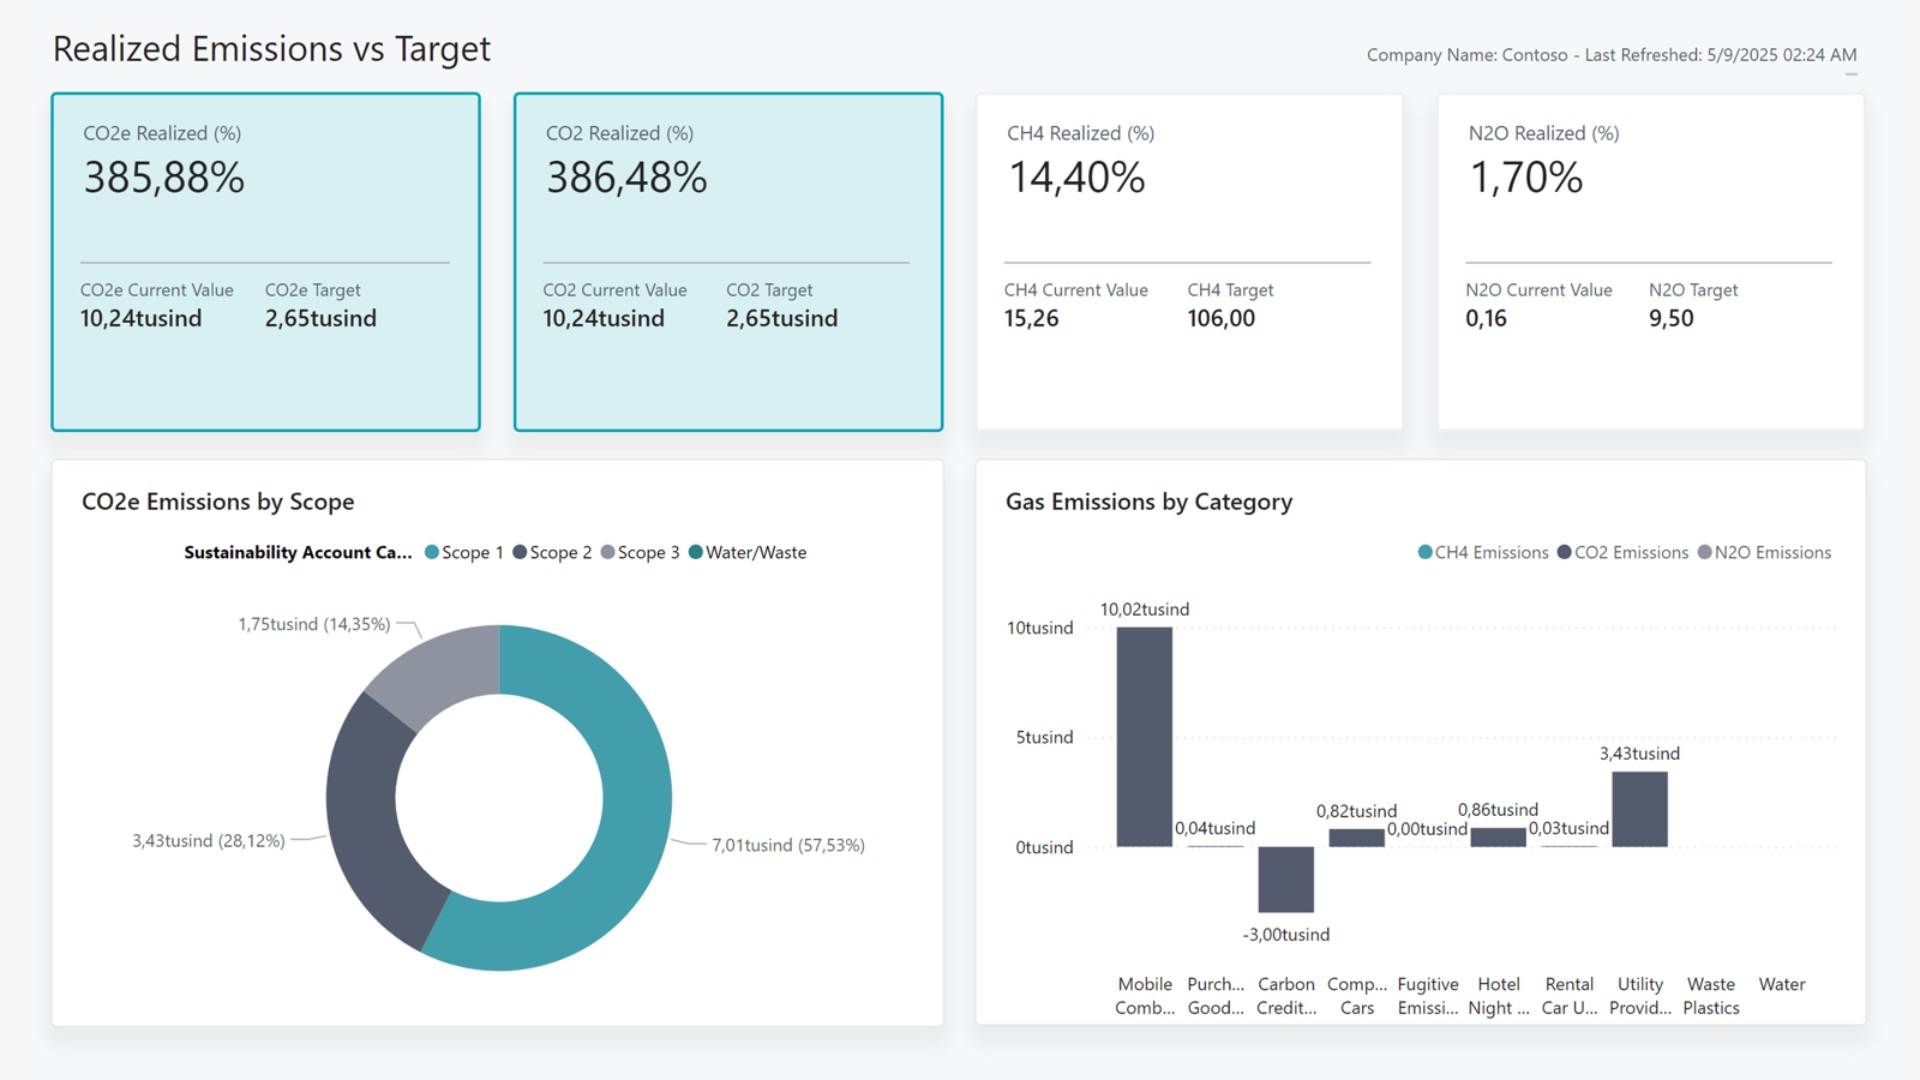
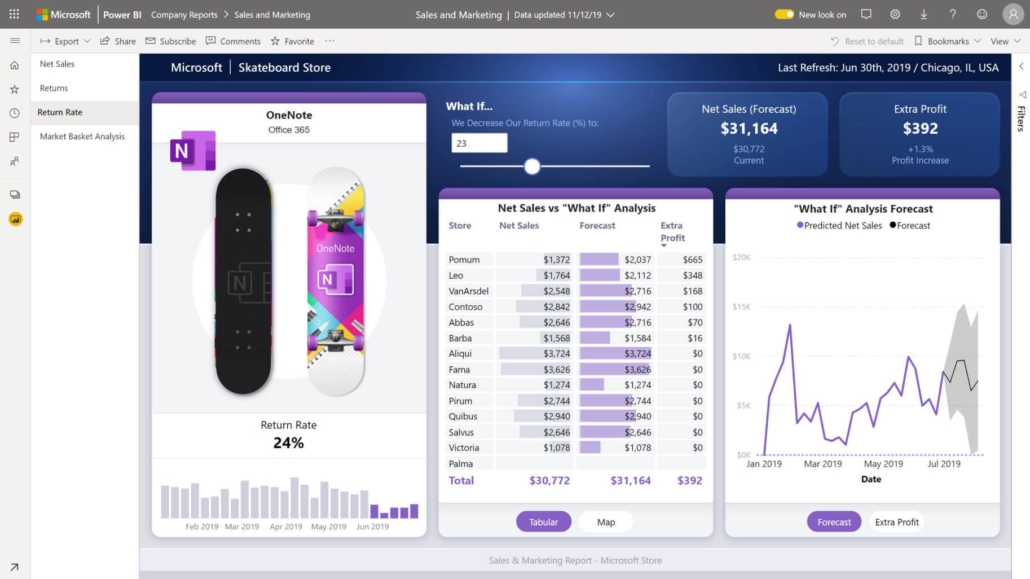
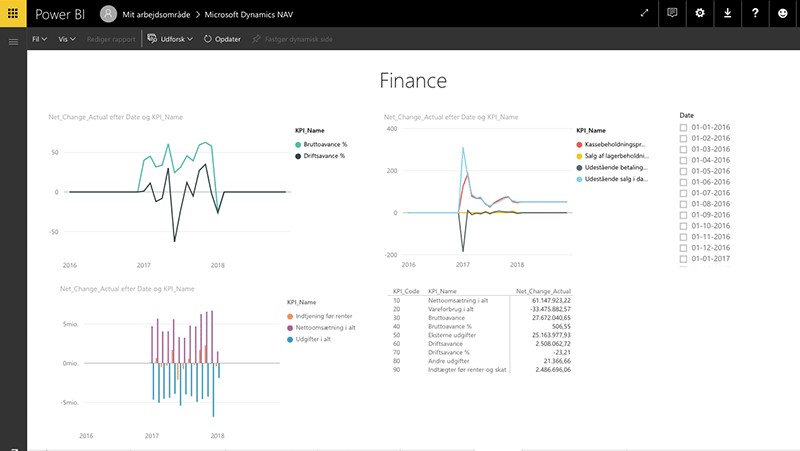
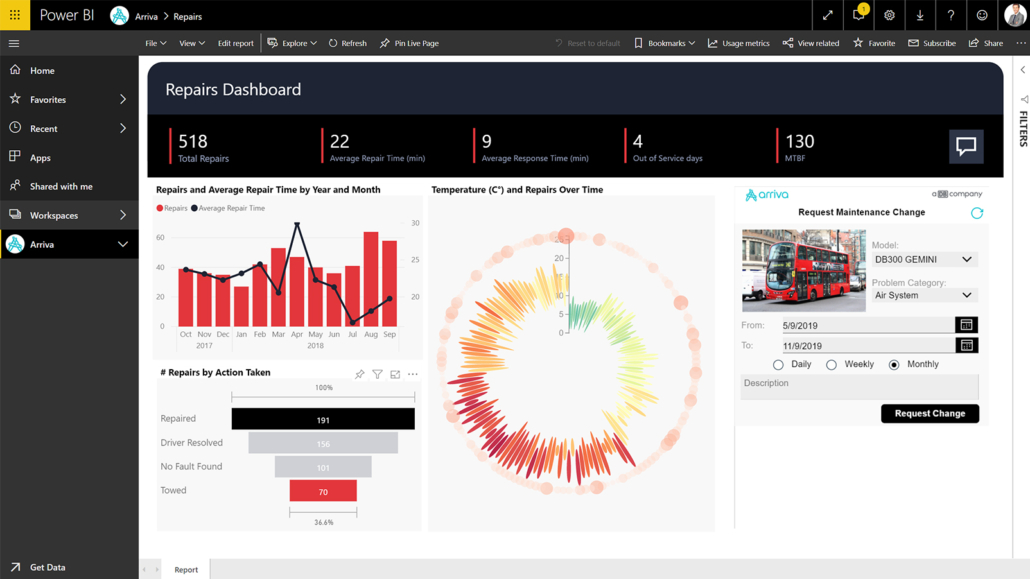
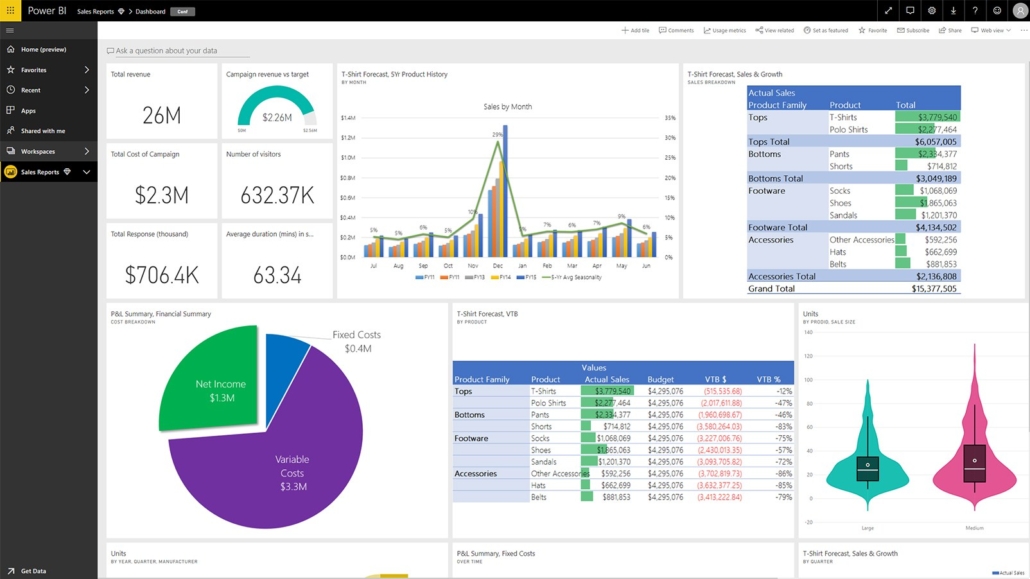
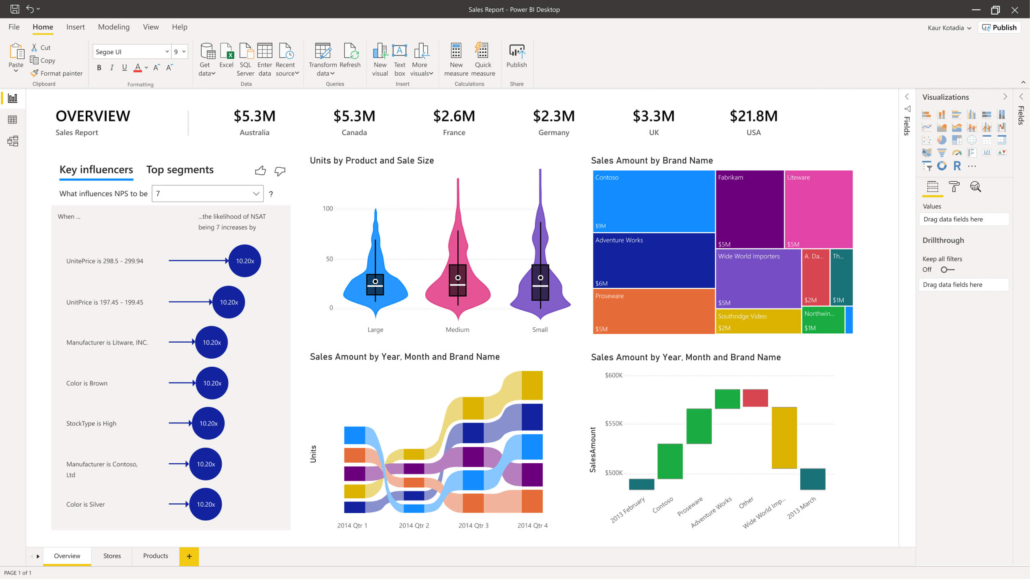
Examples of the many reports for the company’s various departments. Click on the reports to view them in full screen.

Want us to help you?

Get the most out of your free Power BI reports in Business Central—with “BI Kickstart.”

We’ll help you every step of the way—from assessing your needs and setting up the system to training users—and providing inspiration for future use.

Right-dir Right-dir Learn more about BI Kickstart

To get the most out of Microsoft Power BI, your data foundation must be in order

As mentioned, the Power BI dashboard is a tool for visualization. The quality of each Power BI dashboard is entirely dependent on the data that Power BI is fed with. Access to relevant, accurate and up-to-date data from reliable data sources is the foundation of the BI mindset. In order to display the right data in Power BI, you must first build a data model.

If you already have data models

If you’ve already worked systematically with reporting and have the data models in place, it’s relatively easy to get started.

What are data models?

If a company has several different data sources, the volume of data naturally increases. It can be difficult to understand the significance of data if it stands alone. At the same time, it can be difficult to compare data when it comes from different sources. That is why we structure and process data, and organize it into data models that, among other things, take into account the relationships between the various data sets—so that they can be compared.

Data models can either be built directly in Power BI, or you can choose to use a tool that includes prebuilt data models that we can build upon, such as Jet Analytics.

In Power BI, we build data models from scratch. If, on the other hand, we choose to use one of the prebuilt Business Central-specific data models in Jet Analytics, we have a solid foundation to build upon. This means we can use a model that’s already set up and may only need to make minor adjustments to it.

Get to grips with the terms:

Data – all the numbers and information contained in the company’s systems.

Data sources – the various systems where data and information is entered/collected – and from which it can be retrieved.

Data models – abstract models that systematize, organize and standardize data and that take into account the relationships between the many different types of data so that they can be compared.

Visualization – the presentation of data with e.g. Power BI.

If you do NOT have data models yet

However, if you haven’t already worked with reporting, we need to get the data models in place before you can benefit from Power BI. This means that, initially, you need to select relevant data sources from which to retrieve data. These sources need to be incorporated into data models that Power BI can extract data from.

We can help you with that

Why Power BI is relevant for you

Microsoft Power BI gives you a number of benefits:

  • Bigger and faster overview – with graphical presentation of data
  • Better decision making – with updated data
  • Great flexibility – View relevant data on your preferred device (smartphone, tablet, etc.)

Get an overview – with easy-to-use tools

As a starting point, creating customized interactive dashboards is quick.

However, before dashboards can be set up, a well-designed data model must first be built. The data model can be built either directly in Microsoft Power BI or using a tool such as Jet Analytics.

Once the data model is in place, you can set up all the different dashboards and reports you want on your own.

Comprehensive overview of data from multiple sources

With Power BI, you can combine data from multiple sources and display it as easy-to-read charts and tables in a Power BI dashboard.

Power BI is a cloud-based application and an integrated part of Dynamics 365. Power BI can retrieve data from more than 50 different applications, including Business Central, Jet Analytics, and Excel. All selected data is aggregated and presented as a visually appealing snapshot.

Access your data from your preferred device

You can present data and analytics in a single, customized dashboard that can be accessed from your preferred device. This means that updated data, analytics and reports can be accessed exactly when you need it – from PC, smartphone and tablets.

Automate your data update with a single click

You decide whether you want your data to be updated manually or automatically at a set interval. If the update is done automatically, you will get the correct and updated data immediately when you open your dashboard.

With Power BI, you get:

  • Accurate updated data (KPI)
  • Data from multiple data sources at a glance
    – tailored to the individual employee’s tasks
  • Speed
    – data is available exactly when you need it with Power BI’s dynamic dashboard

Microsoft Power BI gives you an overview of your business data and enables you to make better and faster decisions

The synergy and interaction between Jet and Power BI

Many companies can benefit from combining Power BI with Jet Analytics.

Jet Analytics’ strength lies in its ability to retrieve, process and analyze data from Business Central. At the same time, Jet Analytics contains a number of pre-built data models that, with customizations, fit the vast majority of companies.

By using Jet Analytics, you skip the initial work of setting up data models and go straight to customization.

Power BI retrieves data from Jet Analytics, which is then presented and visualized in an optimal way in a dashboard. Once the data model is in place, you can set up all the different dashboards and reports you want in Power BI.

Want us to help you get started with Power BI?

Maybe Power BI alone can do the job, or maybe you’ll get more out of combining your Power BI solution with Jet Analytics?

Write or call us and we’ll talk about your wishes, needs and options.

Send us an email

    Your name

    Your e-mail

    Your phone number.

    Your message

    * We treat your data with respect and do not pass it on. You can request deletion at any time. See our privacy and cookie policy. You will find the link at the bottom of the footer on the website.

    Watch the video about Power BI

    And understand what you can do with the solution